

The Art of Trading
 |
Description
Book Introduction
Stocks are all about timing! 99% win rate with the best trader in Yeouido 16 Situational Trading Timings and Practical Know-How When trading, you are faced with a crossroads of choices at every moment. There are stocks that suddenly become soaring in price with strong buying pressure for unknown reasons. When this happens, you're left wondering whether you should buy them together or sell them as it's a warning sign. The opposite is also true. In a stock where selling pressure suddenly intensifies and the decline widens, I find myself wondering whether I should sell my holdings or increase my holdings since this is just a gesture by the buying force to pull out the stock. When there's an unusually high number of bids or ask orders at a certain price, you want to know exactly what it means. If you participate in the market, things like this happen countless times. The author, renowned as the best trader in Yeouido, has also experienced such situations countless times during his nearly 30 years of practical experience. Over the years, the market environment and investor awareness have changed significantly, but I realized that the principles that drive stock price movements remain the same. Based on this, I have written nine books and taught many individual investors how to make profits by following principles. This book focuses particularly on 'timing'. We've detailed what to watch for and when to buy or sell in 16 situations where there's a high chance of profiting from trading. |
- You can preview some of the book's contents.
Preview
index
Prologue ┃ Stocks are all about timing.
Chapter 1: The Bear and the Bull's Struggle
Interpretation of the Bong and the 50% Rule
Bull vs. Bear: Which Side Will Win?
The bull that lives up, the bear that lives down
Keep 50% of the previous day's gains: The Bull's 50% Rule
Keep 50% of the previous day's candlestick: The Bear's 50% Rule
Check the prices at which buys and sells are concentrated: Buy and Sell Charts and Equivolume Charts
The basic concept contained in the seal
Three Timings for Buying
Rule #1: When the price is above the 5-day moving average.
Buying Rule 2: When the price is between the 5-day and 20-day moving averages.
Rule 3: When the price is below the 20-day moving average
Two Timings for Selling
Sell Rule 1: Above the 5-Day Moving Average
Sell Rule 2: When the price is between the 5-day and 20-day moving averages.
Intraday signals for buying and selling timing
Intraday Signal: Type ①
Intraday Signal: Type ②
Intraday Signal: Type ③
Intraday Signal: Type ④
Chapter 2: Six Key Concepts for Judging Trading Timing
Six Core Concepts
Basic model
The meaning of time and how to use it
The meaning of price and how to use it
What is volume and how to use it?
The meaning and use of movement and stillness
The meaning of speed and how to use it
Support and resistance, breakout
The meaning of support and how to use it
The meaning and use of resistance
The meaning of breakthrough and how to use it
Trend
Meaning of trend
How to utilize each type of trend
pattern
Meaning of pattern
How to use each pattern type
Selection of trading items
How to select stocks before the market opens
How to select intraday stocks
How to select stocks using the HTS function
Chapter 3: Practical Trading Skills
Trading using the momentum of strong stocks
Trading using volume
Timing of buying and selling stocks that are rising continuously
Timing of trading in stocks with consecutive plunges
Timing of buying and selling stocks that surge during the day
Timing of trading in intraday falling stocks
Trading before 10 AM
Trading after 2pm
Trading using the tendencies of each trading party
Massive autonomy transactions and trading decisions
Trading using index movements
Trading using reverse interpretation of the remaining amount of the order book
Trading using the speed and timing of the contract unit
Trading using the uptick rule of short selling and the remaining selling volume
Trading index ETFs based on market movements
Utilizing HTS search functions and OPEN API
Detailed image
Into the book
The market is a battleground between bulls and bears.
A strong buyer is called a bull, and a strong seller is called a bear. If a bull wins, the price rises, and if a bear wins, the price falls.
A particular entity is not always a bull or a bear.
Depending on the time, foreigners can become bulls or bears.
The same goes for institutions and individual powers.
Bulls and bears are always fighting, both in the market as a whole and in individual stocks.
If the bull wins, the market goes up and the bull makes money.
If the bears win, the market falls and the bears make money.
During periods of tight market conditions, the market moves sideways or arbitrage trading linked to the derivatives market determines market fluctuations.
Most investors, other than bulls and bears, have no power to move stock prices.
By watching the fight between the bull and the bear, you have to figure out who is the bull and who is the bear, and figure out which one will win.
And you have to ride on the winning side.
--- p.18
The important thing is that buying or selling a large amount of money does not cause the stock price to rise or fall.
It is not uncommon to see prices fall when buying a large amount of stock, or to see prices rise when selling a large amount of stock.
(…) This means that the stock price does not rise just because you buy in bulk, and the stock price does not fall just because you sell in bulk.
If someone bought in bulk, someone else sold in bulk.
Trading volume is the sum of all buy and sell transactions.
In other words, the stock price does not change because 'you bought a lot' or 'you sold a lot', but rather moves according to the supply and demand of bulls and bears who 'buy by raising the price and sell by lowering the price'.
That is the core of stock price movement and the core of chart analysis.
--- p.22~23
A surge in trading volume, especially instantaneous trading volume, indicates increased volatility and liquidity for the stock.
For whatever reason, the market's attention was focused and trading increased rapidly.
Stocks that fluctuate with high volumes of trading are liquid and therefore advantageous for quick trading, while high volatility means a higher probability of profit from short-term trading.
No matter how good the news is, it is difficult to make a profit without price movement accompanied by trading volume.
Profits can only be made when price changes occur, and price changes do not occur without increased trading volume.
When the price moves, the trading volume should increase, and especially the instantaneous execution volume should increase sharply, which is an important timing.
--- p.118~119
Price movement refers to changes in price, either rising or falling.
When instantaneous transactions occur continuously and the trading volume increases in conjunction with price movements, this is called trading volume movement.
The movement of trading volume becomes rapidly active at the beginning of an uptrend or downtrend, and then gradually stops at some point.
The movement of the bid/ask balance refers to the increase or decrease in the bid/ask balance while the price rises or falls.
As prices fall, the number of ask orders increases, and the number of bid orders decreases as buyers cancel their ask orders.
Then, at some point when the price movement stops, the opposite movement appears in the remaining order volume.
In other words, it can be summarized as 'price movement = trading volume movement = price volatility = trading volume volatility'.
--- p.123
Strong stocks rise more than expected, and weak stocks fall more than expected.
In the market, stocks that are thought to have risen too much often rise further, and stocks that are thought to have fallen too much often fall further.
It is sometimes expressed as so-called upward or downward momentum, but ultimately it is due to supply and demand driven by psychology.
A stock that is rising attracts a psychological buying force driven by greed, and if the stock falls even slightly, a strong buying force comes in, saying that this is an opportunity not to be missed.
(…) Since buying pressure is strong for strong stocks, it is difficult to find the right time to buy if you wait for a downward adjustment.
It usually rises along the 5-day moving average, and any adjustments due to trading battles also end with intraday adjustments and continue to rise.
If a stock that has been rising strongly falls to the price I want, there is a greater chance that the stock will turn bearish later.
--- p.181~182
Stock prices are formed at the balance between buying and selling, that is, the equilibrium point of supply and demand.
If there are absolutely many investors willing to buy even at a high price, it rises, and if there are absolutely many investors willing to sell even at a low price, it falls.
It's just a matter of which side is more dominant, but transactions are formed because there are always buyers and sellers, and when they trade actively, the trading volume increases.
Trading volume is the result of the difference in thinking between buyers and sellers.
It is often said that 'stock investing is the art of timing.'
Even if it is a stock that has risen sharply, you can make a profit or suffer a loss depending on when you buy and sell.
Volume provides timing.
Whether it's a buying or selling moment, the day when trading volume increases significantly is the timing.
The buying timing is when the market leaders start buying by raising the price, and the selling timing is when the market leaders start selling by lowering the price.
Trading volume increases significantly during periods when they are actively buying and selling.
--- p.194
There are stocks that initially surge during the day and then continue to surge daily.
The characteristics of these stocks are that they rise with large volumes of trading, and that the increase is large while creating a trend with continuous increases in a short period of time.
When there is a correction within a day or two after the initial strength, the subsequent buying force becomes stronger if the range is small.
When the price falls, the decline is deep due to sellers seeking to take profits after a series of sharp rises.
As the short-term surge increases, the volatility is also high.
On the other hand, when the price falls, buying power also flows in strongly.
This is because there are many buyers waiting to buy in anticipation of further increases after the adjustment.
(…) The trading point for stocks with consecutive surges is to take advantage of the upward momentum.
The higher the stock price, the stronger the upward momentum becomes due to chase buyers.
We seek to profit by buying when the price temporarily declines in the morning and then taking advantage of the upward momentum that arises again.
And, when a stock that has been falling throughout the day due to profit-taking begins to rise in the afternoon due to the re-entry of buying forces, it is bought.
It is about seeking profits by taking advantage of the momentum that rises again from the next day.
--- p.212~214
Publisher's Review
In the most liquid market of all time
Which investors really made money?
Amid the COVID-19 pandemic, central governments around the world unleashed record levels of liquidity, which flowed into asset markets, particularly stock markets.
Korea is no exception.
In 2021 alone, the number of stock trading accounts increased by 5 million, surpassing 40 million accounts, a record high.
This is a count of accounts where transactions are actually taking place.
This is because many people have realized that although there is more money in circulation, there is no place to put it, and if you keep it in bank deposits like before, the real interest rate will be negative due to inflation.
The KOSPI more than doubled from its March 2020 low, breaking out of the box and hitting a new high.
But which investors made money in this incredibly liquid market?
When a stock price, which had been moving slowly for a while, suddenly soars with a surge in trading volume, is it the investor who chased it and bought it? Is it the investor who bought a stock that created an unusually long bullish candlestick and broke above the 20-day or 5-day moving average? Or, conversely, is it the investor who bought a stock at the bottom after a sharp decline with a surge in trading volume? Or is it the investor who quickly sold when the price broke below the 5-day or 20-day moving average and secured their profits? All of these investors may or may not have made money.
One thing is clear: someone will keep the money they earned and steadily increase their profits.
Here, 'someone' is someone who sets his own principles and sticks to them no matter what.
Investing is something you have to do for a lifetime, so even if you make a profit today, it's meaningless if you lose money tomorrow.
Profitable trading must be based on principles, and profits can only be increased by accumulating investment experience and refining those principles.
Of course, there is no investor who does not know the necessity of principles.
But how should we establish those principles? Moreover, given the diverse circumstances and investment tendencies of each individual, is there a universally applicable principle? This book provides the answer.
Trading principles derived from six key elements of stock price movement
16 situational trading techniques summarized
The author identifies six key concepts for determining trading timing: time, price, volume, movement and pause, and speed.
Here, we added support and resistance, breakouts, trends, and patterns to derive the three buying and two selling principles.
The first rule of thumb for buying is to buy stocks that are rising sharply above the 5-day moving average when they decline in the morning or rise after selling off in the afternoon. The second rule of buying is to buy when a bullish candle with high trading volume appears again after a correction decline with decreasing trading volume between the 5-day moving average and the 20-day moving average. The third rule of buying is to buy when a stock that has plummeted below the 20-day moving average or has been in a long-term downtrend forms a cross or bullish candle with large volume transactions.
The first rule of selling is to sell above the 5-day moving average, and the second rule is to sell when a bearish candlestick with high trading volume appears near the 20-day moving average.
By applying this principle, we have summarized 16 situations with a high probability of generating profits and explained in detail how to respond to them.
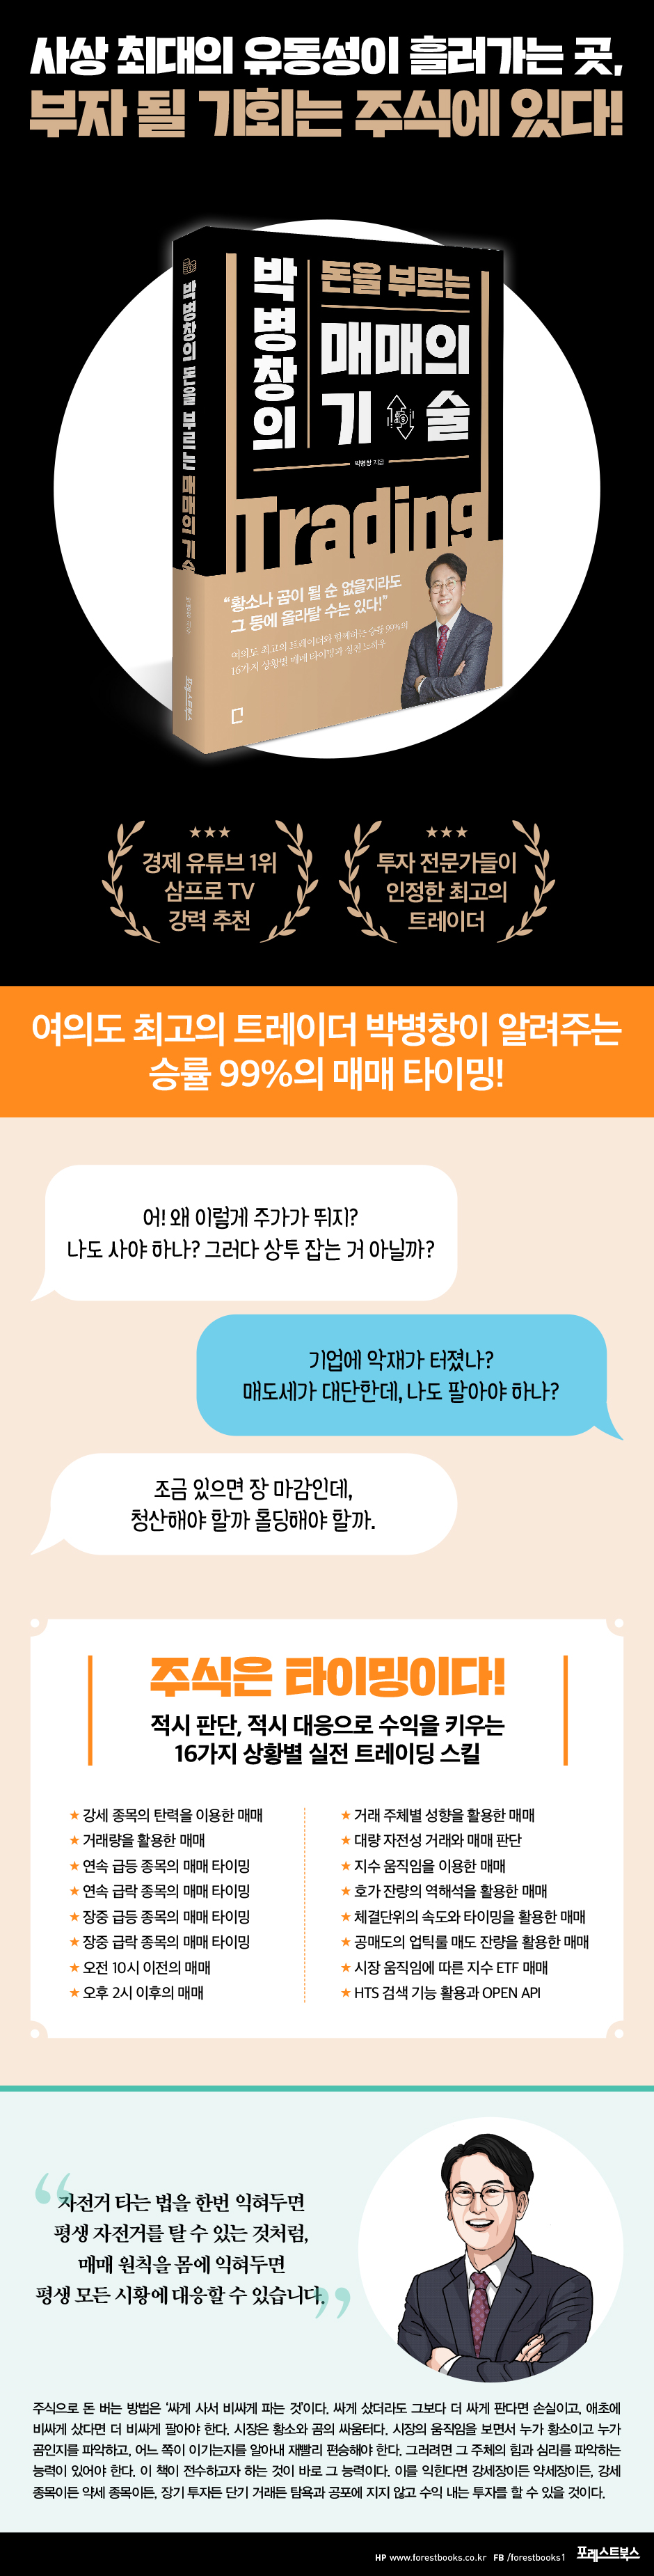
★ Trading using the momentum of strong stocks
★ Trading using trading volume
★ Trading timing for stocks with consecutive surges
★ Trading timing for stocks with consecutive plunges
★ Timing for buying and selling stocks that are rising sharply during the day
★ Timing for buying and selling stocks that plummet during the day
★ Trading before 10 AM
★ Trading after 2 PM
★ Trading using the tendencies of each trading party
★ Massive self-transaction and trading judgment
★ Trading using index movements
★ Trading using reverse interpretation of the remaining order volume
★ Trading using the speed and timing of the contract unit
★ Trading using the uptick rule of short selling and the remaining selling volume
★ Trading index ETFs based on market movements
★ Utilizing HTS search function and OPEN API
The above 16 situations are ones that investors often encounter, and everyone has probably thought about how to judge and respond to them at least once.
However, there are differences in investment tendencies; some people feel comfortable trading stocks that are rising rapidly, while others feel comfortable buying at the bottom after a sharp decline.
Therefore, you should choose a trading situation that suits your tendencies.
In doing so, you will create your own customized principles by applying the three principles of buying and the two principles of selling.
If you learn trading principles that will last a lifetime,
Become an investor who can respond to any market situation
The book also explains in detail the process and reasons for deriving trading principles.
Because only by understanding this can you make the principles your own.
The fundamental reason for market movements is the power struggle between bulls and bears.
When bulls dominate (i.e., they buy by pushing up the price), the market rises, and when bears dominate (i.e., they sell by pushing down the price), the market falls.
The more intense the competition, the more trading takes place, so the trading volume increases rapidly.
Surges in trading volume increase price volatility, and volatility presents trading opportunities for traders.
The purpose of this book is to develop the ability to judge timing when such opportunities arise.
Both short-term and long-term investors need to be able to judge timing to maximize returns.
Because the way to make money in stocks is to buy low and sell high.
If you acquire the eye for timing through this book, you will be able to respond wisely to any market situation or any stock.
Which investors really made money?
Amid the COVID-19 pandemic, central governments around the world unleashed record levels of liquidity, which flowed into asset markets, particularly stock markets.
Korea is no exception.
In 2021 alone, the number of stock trading accounts increased by 5 million, surpassing 40 million accounts, a record high.
This is a count of accounts where transactions are actually taking place.
This is because many people have realized that although there is more money in circulation, there is no place to put it, and if you keep it in bank deposits like before, the real interest rate will be negative due to inflation.
The KOSPI more than doubled from its March 2020 low, breaking out of the box and hitting a new high.
But which investors made money in this incredibly liquid market?
When a stock price, which had been moving slowly for a while, suddenly soars with a surge in trading volume, is it the investor who chased it and bought it? Is it the investor who bought a stock that created an unusually long bullish candlestick and broke above the 20-day or 5-day moving average? Or, conversely, is it the investor who bought a stock at the bottom after a sharp decline with a surge in trading volume? Or is it the investor who quickly sold when the price broke below the 5-day or 20-day moving average and secured their profits? All of these investors may or may not have made money.
One thing is clear: someone will keep the money they earned and steadily increase their profits.
Here, 'someone' is someone who sets his own principles and sticks to them no matter what.
Investing is something you have to do for a lifetime, so even if you make a profit today, it's meaningless if you lose money tomorrow.
Profitable trading must be based on principles, and profits can only be increased by accumulating investment experience and refining those principles.
Of course, there is no investor who does not know the necessity of principles.
But how should we establish those principles? Moreover, given the diverse circumstances and investment tendencies of each individual, is there a universally applicable principle? This book provides the answer.
Trading principles derived from six key elements of stock price movement
16 situational trading techniques summarized
The author identifies six key concepts for determining trading timing: time, price, volume, movement and pause, and speed.
Here, we added support and resistance, breakouts, trends, and patterns to derive the three buying and two selling principles.
The first rule of thumb for buying is to buy stocks that are rising sharply above the 5-day moving average when they decline in the morning or rise after selling off in the afternoon. The second rule of buying is to buy when a bullish candle with high trading volume appears again after a correction decline with decreasing trading volume between the 5-day moving average and the 20-day moving average. The third rule of buying is to buy when a stock that has plummeted below the 20-day moving average or has been in a long-term downtrend forms a cross or bullish candle with large volume transactions.
The first rule of selling is to sell above the 5-day moving average, and the second rule is to sell when a bearish candlestick with high trading volume appears near the 20-day moving average.
By applying this principle, we have summarized 16 situations with a high probability of generating profits and explained in detail how to respond to them.
★ Trading using the momentum of strong stocks
★ Trading using trading volume
★ Trading timing for stocks with consecutive surges
★ Trading timing for stocks with consecutive plunges
★ Timing for buying and selling stocks that are rising sharply during the day
★ Timing for buying and selling stocks that plummet during the day
★ Trading before 10 AM
★ Trading after 2 PM
★ Trading using the tendencies of each trading party
★ Massive self-transaction and trading judgment
★ Trading using index movements
★ Trading using reverse interpretation of the remaining order volume
★ Trading using the speed and timing of the contract unit
★ Trading using the uptick rule of short selling and the remaining selling volume
★ Trading index ETFs based on market movements
★ Utilizing HTS search function and OPEN API
The above 16 situations are ones that investors often encounter, and everyone has probably thought about how to judge and respond to them at least once.
However, there are differences in investment tendencies; some people feel comfortable trading stocks that are rising rapidly, while others feel comfortable buying at the bottom after a sharp decline.
Therefore, you should choose a trading situation that suits your tendencies.
In doing so, you will create your own customized principles by applying the three principles of buying and the two principles of selling.
If you learn trading principles that will last a lifetime,
Become an investor who can respond to any market situation
The book also explains in detail the process and reasons for deriving trading principles.
Because only by understanding this can you make the principles your own.
The fundamental reason for market movements is the power struggle between bulls and bears.
When bulls dominate (i.e., they buy by pushing up the price), the market rises, and when bears dominate (i.e., they sell by pushing down the price), the market falls.
The more intense the competition, the more trading takes place, so the trading volume increases rapidly.
Surges in trading volume increase price volatility, and volatility presents trading opportunities for traders.
The purpose of this book is to develop the ability to judge timing when such opportunities arise.
Both short-term and long-term investors need to be able to judge timing to maximize returns.
Because the way to make money in stocks is to buy low and sell high.
If you acquire the eye for timing through this book, you will be able to respond wisely to any market situation or any stock.
GOODS SPECIFICS
- Date of issue: May 14, 2021
- Page count, weight, size: 412 pages | 756g | 152*225*21mm
- ISBN13: 9791191347180
- ISBN10: 1191347184
You may also like
카테고리
korean


korean

![ELLE 엘르 스페셜 에디션 A형 : 12월 [2025]](http://librairie.coreenne.fr/cdn/shop/files/b8e27a3de6c9538896439686c6b0e8fb.jpg?v=1766436872&width=3840)


