

Eye of Science
 |
Description
Book Introduction
See the invisible world beyond human senses!
The power of images to move beyond the transmission of knowledge
The technology that makes the invisible visible has become the eye of science,
Through the eyes of science, we have come to see a wider, deeper, and more delicate world.
From things too small to see to things too vast to see, scientists have developed a variety of visualization tools to explain the world that exists beyond our human senses even though it is invisible to the naked eye.
Whether it's a simple numerical graph drawn by hand on graph paper or an elaborate image created through computer simulation, the visualization of scientific knowledge has something in common.
First, it contains complex theories or vast amounts of data in a single image, and second, that single image is far more persuasive than a hundred words of explanation.
Sometimes, it goes beyond imparting knowledge and evokes unexpected emotions or awakens a sense of alarm, making us reflect on the course of humanity.
This is the power of images, the power of visualization.
"The Eye of Science" is a book that presents scientific knowledge from various fields in a single image, rather than explaining it in a complex way.
Every time you turn the page, you are presented with a feast of images that stimulate your curiosity and leave a strong impression.
Above all, by demonstrating the process of exploring science visually, it demonstrates how visual information has played a significant role in the scientific understanding and achievements that humanity has achieved today.
- You can preview some of the book's contents.
Preview
index
To begin with: to see, to show
Part 1 | Making the Invisible Visible
Microscopes and telescopes that go beyond the limits of the eye
Photography and electron microscopy to capture information
The world beyond the visible spectrum
Fields and particles are everywhere
Part 2 | Data, Information, Knowledge, and Visualization
Data visualization, turning complex numbers into images
Information dissemination, out of the lab and into the public
Transferring knowledge, leading to new discoveries
Part 3 | Mathematical Models and Simulations
Mathematical modeling of the real world
Computational fluid dynamics for predicting flows
Part 4 | Art in Science
The art and science of giving and receiving inspiration
The Art of Time Travel, Paleoart
A meeting of infinite possibilities, space art
Translator's Note
References
Copyright of the painting
Detailed image
Into the book
We live in an invisible pattern of delicate beauty and sophisticated chaos that exists at every scale.
Invisible radiation pours out from all sides, filling all space and surrounding us in a changing field.
Our cells, intricate molecular machines, are too small to be seen, and the story of our origins stretches back unimaginably far.
The only way to understand the discoveries of science is to imagine them in our minds, or even better, to picture them before our eyes.
--- p.9, from “Starting: See, Show”
A microscope creates magnified images of small objects, and a telescope creates magnified images of distant objects.
The eyepiece projects a magnified image into our view, resulting in a much larger image on our retina than would be possible if we were to view the same object with the naked eye.
Microscopes and telescopes allow us to perceive things that are too small or too far away for the naked eye to see.
--- p.13, from “Microscopes and Telescopes Beyond the Limits of the Eye”
An electron microscope creates an image by detecting the electrons that pass through or bounce off an object when an electron beam is shined on it.
The wavelength of electrons is much shorter than the wavelength of visible light.
Therefore, the resolution limit of an electron microscope is much narrower than that of an optical microscope.
Because of this difference, electron microscopes can magnify up to 50 million times, while light microscopes can only magnify up to 2,000 times.
--- p.20, from “Photography and Electron Microscopy to Capture Information”
There are countless natural phenomena that emit electromagnetic radiation.
Because the human eye can detect only visible light, a very small portion of the electromagnetic spectrum, many of these fascinating phenomena went unnoticed until technology was developed to detect other types of radiation.
Perhaps the scientific field that has benefited most from this technology is astronomy.
Numerous celestial objects that do not emit visible light at all have been discovered through radio telescopes or infrared telescopes.
The radiation emitted by celestial bodies contains valuable data that can reveal important information such as the composition of the celestial bodies, their temperature, and the energy processes occurring within them.
--- p.49, from “The World Beyond the Visible Spectrum”
Electrons, atoms, and molecules cannot be directly observed even with the resolution of an electron microscope, let alone an optical microscope.
For decades, scientists have been resigned to these limitations.
But in the 1980s, scientists at IBM Research invented a revolutionary tool that could create detailed images of the surface of atoms.
This is the scanning tunneling microscope (STM), invented by Gerd Binnig and Heinrich Rohrer.
A scanning tunneling microscope is a microscope that records changes in current that cause tunneling (a phenomenon in which electrons pass through a material with wave properties) by scanning the surface of a material with a very sharp tip, and uses this data to identify minute undulations on the surface of the material.
Starting with the scanning tunneling microscope, various types of microscopes using probes (scanning probe microscopes) have been developed, enabling the visualization of a wider variety of materials.
--- p.70, from “The Field and Particles Everywhere”
When defining the characteristics of big data, the three Vs are often mentioned.
These are Volume, Variety, and Velocity.
Big data is usually a large amount of data (volume) of various types (variety) from various sources, and is generally received and processed quickly (speed).
When massive amounts of data are input quickly, many computers perform storage and processing simultaneously.
When dealing with such large amounts of data, another V, visualization, will become a key element.
--- p.102, from "A Deep Dive: Big Data"
The enlightenment that knowledge brings is a joy and fascination in itself, but it also has practical benefits.
People in diverse fields, including engineers, architects, policymakers, and artists, utilize scientific knowledge.
Therefore, scientists who discover new knowledge have both a duty and a desire to communicate it not only to other scientists but also to the wider community.
--- p.132, from “Knowledge Transfer, Leading to New Discoveries”
Computer simulations have been used primarily in fields such as physics, chemistry, earth science, and astronomy, but they are now playing a growing role in other fields as well.
In biology, accurately modeling organs on computers allows researchers to experiment with "living" systems in silico (computer) rather than in vivo (living organism).
--- p.153, from “Mathematical Modeling of the Real World”
Space art and paleo art have distinctly different themes.
There is one more difference.
While we can't go back in time and compare paleoart to real-life (unless we're recreating extinct species Jurassic Park-style), some scenes from space art have already been captured in images, and there's every chance we'll be able to do so in the future.
In fact, Chesley Bonestell drew Saturn's rings with remarkable precision, and later space probes captured similar scenes in photographs.
Future telescopes may be able to reveal detailed images of exoplanets or even produce sharp images of quasars, which currently appear as faint, fuzzy dots.
--- p.246, from “Encounter of Infinite Possibilities, Space Art”
Publisher's Review
* Galileo's drawing of the moon, observing and drawing craters on the moon through a telescope
* Nightingale's pie chart, which dramatically reduced the death rate of soldiers.
* Hubble's line graph, the first to provide evidence that the universe is expanding
* Warming stripes that show the reality of global warming at a glance
* Scanning electron microscope image of SARS-CoV-2, the virus that causes COVID-19.
* Tractograms, which attempt to map complex brain structures down to the level of individual neurons
The power of visualization is clearer and more persuasive than a hundred words of explanation.
A collection of monumental visualizations that have driven scientific advancements!
In 1911, Arthur Brisbane, editor of the New York Evening Journal, advised a meeting of advertisers:
“Use the photo.
“A word is worth a thousand words.” We are not only familiar with this saying, but also bombarded with advertising images.
Those images seep into our brains and arouse desire more effectively and immediately than words.
One of the reasons images are so powerful is that the information they contain is conveyed 'in parallel' and simultaneously.
On the other hand, for speech or writing to be communicated, words must be transmitted and consumed in sequence.
Images can contain a lot of detail, including color, shape, distance between objects, groups of objects, facial expressions, body posture, movement, and the atmosphere of a place.
Our brain interprets all of this amazingly quickly.
Just as images have a special power in advertising, so too do they in science.
Through over 150 examples, "The Eyes of Science" demonstrates the importance of images in science and how they are used.
Making the invisible visible
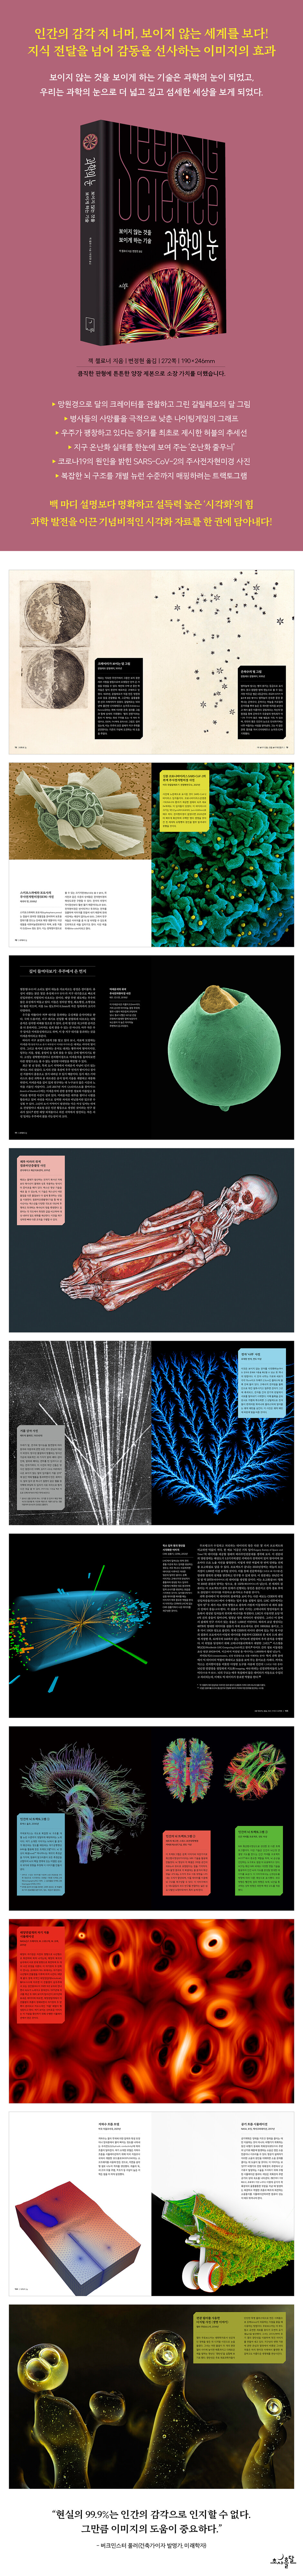
“Images are crucial because 99.9% of reality is beyond the reach of human senses,” said Buckminster Fuller, architect, inventor, and futurist.
There is much more to this world than meets the eye.
The air is full of tiny dust particles and water droplets, and is made up of countless atoms and molecules, most of which move faster than a jet plane.
Radiation beyond the visible spectrum travels at the speed of light, and particles from outside the Earth pass through our bodies more easily than a hot knife cuts through butter.
Electric and magnetic fields fill all space in the universe, and countless processes occur so quickly that we cannot perceive them, or conversely, so slowly that we cannot notice them.
To represent objects that are normally invisible to the naked eye as images, you need technology that allows you to see the objects in the first place, such as a microscope, telescope, infrared, or high-speed camera.
Images created with this technology aid scientific understanding by revealing the invisible.
Data, Information, Knowledge, and Visualization
Science is the study of knowledge about the world we live in.
'Knowledge' can be obtained by establishing and verifying hypotheses.
To form a hypothesis, you need ‘information’, and to produce information and verify a hypothesis, you need ‘data’.
Data is usually made up of numbers, which in themselves have little meaning.
To understand data, communicate information, and impart knowledge, we need to 'visualize' it.
So scientists across all disciplines are routinely going beyond analyzing data to creating clear, compelling visuals to share with colleagues and the public.
Almost every scientific paper today includes an image that interprets the data.
Mathematical models and simulations
Galileo Galilei described the universe as “a great book written in the language of mathematics.”
In science, mathematics plays an important role in more than simply collecting and analyzing data.
Scientists use algebra to describe and predict the behavior of objects and systems, and algebraic equations can model real-world phenomena.
In today's computing age, we can simulate the real world by implementing mathematical models using a variety of initial conditions.
Computer simulations allow scientists to test their hypotheses by predicting outcomes that can be compared to the real world.
The key is that scientists can visualize the output of mathematical models or simulation results, making the information accessible not only to fellow scientists but also to the wider public.
Art in Science
From the scribbles scientists create to flesh out their ideas to the animations they create to communicate their findings broadly, the role of art in science is incredibly diverse.
Some artists collaborate with scientists to create scenes that contain information about things we can't see with our eyes, such as scenes from the distant past or objects in deep space.
Creative works expressed in this way make complex topics easier to understand, thereby conveying scientific knowledge to a wider audience.
Sometimes artists go beyond conveying knowledge to elicit emotion by expressing scientific ideas in a more abstract way.
Collaborating with artists allows scientists to clearly demonstrate their research, and the new insights science brings provide artists with abundant inspiration.
Collaborations between science and art are becoming increasingly common as academic trends shift from STEM (science, technology, engineering, and math) to STEAM (with the A standing for arts).
《The Eye of Science》 is a book that presents scientific knowledge from various fields in a single image, rather than explaining it in a complex way.
Every time you turn the page, you are presented with a feast of images that stimulate your curiosity and leave a strong impression.
As you read each explanation, wondering, "How on earth did they take this photo?", "Do the cells in my body look like that?", "What is the identity of this mysterious image?", you'll find that at some point your questions will be answered, and at other points, you'll find yourself inspired to learn more about the field.
And anyone can't help but fall under the spell of science.
* Nightingale's pie chart, which dramatically reduced the death rate of soldiers.
* Hubble's line graph, the first to provide evidence that the universe is expanding
* Warming stripes that show the reality of global warming at a glance
* Scanning electron microscope image of SARS-CoV-2, the virus that causes COVID-19.
* Tractograms, which attempt to map complex brain structures down to the level of individual neurons
The power of visualization is clearer and more persuasive than a hundred words of explanation.
A collection of monumental visualizations that have driven scientific advancements!
In 1911, Arthur Brisbane, editor of the New York Evening Journal, advised a meeting of advertisers:
“Use the photo.
“A word is worth a thousand words.” We are not only familiar with this saying, but also bombarded with advertising images.
Those images seep into our brains and arouse desire more effectively and immediately than words.
One of the reasons images are so powerful is that the information they contain is conveyed 'in parallel' and simultaneously.
On the other hand, for speech or writing to be communicated, words must be transmitted and consumed in sequence.
Images can contain a lot of detail, including color, shape, distance between objects, groups of objects, facial expressions, body posture, movement, and the atmosphere of a place.
Our brain interprets all of this amazingly quickly.
Just as images have a special power in advertising, so too do they in science.
Through over 150 examples, "The Eyes of Science" demonstrates the importance of images in science and how they are used.
Making the invisible visible
“Images are crucial because 99.9% of reality is beyond the reach of human senses,” said Buckminster Fuller, architect, inventor, and futurist.
There is much more to this world than meets the eye.
The air is full of tiny dust particles and water droplets, and is made up of countless atoms and molecules, most of which move faster than a jet plane.
Radiation beyond the visible spectrum travels at the speed of light, and particles from outside the Earth pass through our bodies more easily than a hot knife cuts through butter.
Electric and magnetic fields fill all space in the universe, and countless processes occur so quickly that we cannot perceive them, or conversely, so slowly that we cannot notice them.
To represent objects that are normally invisible to the naked eye as images, you need technology that allows you to see the objects in the first place, such as a microscope, telescope, infrared, or high-speed camera.
Images created with this technology aid scientific understanding by revealing the invisible.
Data, Information, Knowledge, and Visualization
Science is the study of knowledge about the world we live in.
'Knowledge' can be obtained by establishing and verifying hypotheses.
To form a hypothesis, you need ‘information’, and to produce information and verify a hypothesis, you need ‘data’.
Data is usually made up of numbers, which in themselves have little meaning.
To understand data, communicate information, and impart knowledge, we need to 'visualize' it.
So scientists across all disciplines are routinely going beyond analyzing data to creating clear, compelling visuals to share with colleagues and the public.
Almost every scientific paper today includes an image that interprets the data.
Mathematical models and simulations
Galileo Galilei described the universe as “a great book written in the language of mathematics.”
In science, mathematics plays an important role in more than simply collecting and analyzing data.
Scientists use algebra to describe and predict the behavior of objects and systems, and algebraic equations can model real-world phenomena.
In today's computing age, we can simulate the real world by implementing mathematical models using a variety of initial conditions.
Computer simulations allow scientists to test their hypotheses by predicting outcomes that can be compared to the real world.
The key is that scientists can visualize the output of mathematical models or simulation results, making the information accessible not only to fellow scientists but also to the wider public.
Art in Science
From the scribbles scientists create to flesh out their ideas to the animations they create to communicate their findings broadly, the role of art in science is incredibly diverse.
Some artists collaborate with scientists to create scenes that contain information about things we can't see with our eyes, such as scenes from the distant past or objects in deep space.
Creative works expressed in this way make complex topics easier to understand, thereby conveying scientific knowledge to a wider audience.
Sometimes artists go beyond conveying knowledge to elicit emotion by expressing scientific ideas in a more abstract way.
Collaborating with artists allows scientists to clearly demonstrate their research, and the new insights science brings provide artists with abundant inspiration.
Collaborations between science and art are becoming increasingly common as academic trends shift from STEM (science, technology, engineering, and math) to STEAM (with the A standing for arts).
《The Eye of Science》 is a book that presents scientific knowledge from various fields in a single image, rather than explaining it in a complex way.
Every time you turn the page, you are presented with a feast of images that stimulate your curiosity and leave a strong impression.
As you read each explanation, wondering, "How on earth did they take this photo?", "Do the cells in my body look like that?", "What is the identity of this mysterious image?", you'll find that at some point your questions will be answered, and at other points, you'll find yourself inspired to learn more about the field.
And anyone can't help but fall under the spell of science.
GOODS SPECIFICS
- Date of issue: March 4, 2024
- Format: Hardcover book binding method guide
- Page count, weight, size: 272 pages | 1,170g | 190*246*25mm
- ISBN13: 9791197739743
- ISBN10: 1197739742
You may also like
카테고리
korean


korean

![ELLE 엘르 스페셜 에디션 A형 : 12월 [2025]](http://librairie.coreenne.fr/cdn/shop/files/b8e27a3de6c9538896439686c6b0e8fb.jpg?v=1766436872&width=3840)


