

How to Find the Best Timing for Stock Investment
 |
Description
Book Introduction
A must-read classic in technical analysis Bestseller on Amazon for 33 years and in Korea for 13 years Revised and translated edition published in 2020 There are two main types of stock investment strategies. One is fundamental analysis, a traditional method that analyzes corporate value through corporate disclosures, financial statements, and cash flow statements, and makes investment decisions based on internal and external factors such as performance and competitiveness. Another is technical analysis. This is a method of investing by predicting future stock prices by finding certain patterns or trends in stock price movements such as charts, trading volume, and auxiliary indicators. A famous book that has won the hearts of stock investors for its chart-first philosophy in technical analysis is Stan Weinstein's "Stan Weinstein's Secrets For Profiting in Bull and Bear Markets." This book was first published in the United States in 1988 and was translated and published in Korea in 2007 under the title “Unbeatable Stock Investment: Learning with Charts.” The translated version has since gone out of print and is now considered by stock investors as the "Bible of Technical Analysis" and a "Classic for Investors," and is on lists of recommended books and must-reads. However, after going out of print, it was not republished and was only passed down through word of mouth among investors, being traded in the used book market for more than 10 times the list price. This book covers everything stock investors want to know, including the basics of chart reading according to the four stages of the stock cycle, stock selection methods that increase the probability of success, how to identify stocks that should not be touched, how to buy with high returns, and how to know when to sell. Additionally, we added the section on 'short selling' that was omitted from the 2007 edition, added faithful supplementary commentary such as the translator's commentary and notes, and corrected minor errors in the text to establish the framework for a complete translation. In this book, republished in its original form, you will be able to hear the author's passionate lectures. |
- You can preview some of the book's contents.
Preview
index
Introduction | 5 Secrets to Consistent Profitability
Preface to the Revised Edition | A Classic Investment Guide Written by a Wall Street Legend
Chapter 1 | The Real Information Is All in the Charts
'Buy low, sell high' is wrong.
The Secrets of Building Wealth from Experts
Why a Technical Approach Matters 30
Learn basic chart terminology
The Basics of Reading Charts
Chapter 2 | First Steps for Chart Analysis Experts
Charts send messages
The 4 Stages of the Stock Cycle as Seen on Charts
Hands-on chart case study
Chapter 3 | Finding the Optimal Buying Point
The buying point that maximizes the probability of success
The Investor's Path: Investors buy on breakouts and buy again on pullbacks.
The Trader's Path: Traders Buy Just Before the Second Breakout
Make a stress-free purchase decision
3 Regularly Occurring Market Patterns
When not to buy
First look at the forest and then choose the trees.
The Investor's Guide: Why You Shouldn't Trust the News
Which industry to choose
How to Read Industry and Individual Stocks
Chapter 4 | How to Pick the Highest-Profitable Individual Industries
There should be little resistance
There must be a lot of trading volume
RS must support
The Investor's Guide: What to Check Before Buying
The Investor's Path: Two Head-and-Shoulders Patterns That Guarantee Big Returns
The base area must be wide
Checklist of Stocks to Avoid
Divide your investment into several categories
Translator's Note: RS is not relative strength, but complementary strength.
Chapter 5 | The Special Secret to Outstanding Profits
The chart already knows about the merger and acquisition.
3 Things That Make A+ Stocks Great
Chapter 6 | Finding the Optimal Selling Timing
The chart tells you when to sell.
8 Principles That People Who Sell Too Hard Miss
When to sell an investor
Trader's selling point
The Law of Swings: The Optimal Selling Point
Let go of your pride and trust the charts.
Chapter 7 | How to Use Short Selling to Generate Substantial Profits
If you can make a profit even in a bear market
Why are you so afraid of short selling?
3 Mistakes People Make When Short Selling
When not to short sell
The best time to short sell
6 Steps to Profitability
It's never too late
Reading Patterns That Generate Extraordinary Profits
Another way to reduce risk
Chapter 8 | Using Indicators to Identify Bull and Bear Markets
Market indicators predict stock market trends.
Step analysis method that tells you the market average
Rising-falling lines predicting long-term trends
Market Resilience Index to Find the Best Areas
High-low readings that diagnose the health of the market
Global stock market trends affecting the domestic stock market
Monitor movements using major stocks as indicators.
P/D ratio that finds the top and bottom
The "Theory of Conflicting Opinions": How to Avoid Being Swept Away by Crowd Psychology
Chapter 9 | Charting the Fund, Options, and Futures Markets
Fund investment method using charts
Short-term fund trading and MA lines
How to Target Industry Funds Using Charts
Options, an exciting but dangerous game
Futures Trading Challenges with Technical Analysis
Chapter 10 | Prioritize Planning and Discipline Over Technical Analysis
Once you establish investment principles, stick to them without exception.
Final advice for honing your investment skills
Detailed image
Into the book
“Buy low, sell high! That’s how you make money.”
Is that right? No, it's wrong.
This is just a common cliche that people who have suffered losses always chant.
There are things that should not be done in the stock market, but there is a misconception that they must be done.
For example, to fully understand the economic and industrial development situation, you should carefully read the economic sections of newspapers and magazines, watch economic news on television in the evenings, or listen carefully to the advice of a well-dressed stock market expert.
Investors believe that's how they'll make money, but that's never going to make their pockets any fatter.
--- p.21
The first thing to note is the high-low-closing peaks of each price.
After all, reading the stock price trend is the most important thing.
Stock prices follow certain patterns over time.
This pattern is a clue that can help us predict how the stock will move in the future.
The second thing to look at is the stock trading volume for that week.
It is a very desirable phenomenon for trading volume to increase when the stock price rises and decrease when the stock price falls.
As I mentioned before and will emphasize often in the future, it is very good to see increased trading volume at the breakout point.
The huge volume leads to urgent and certain buying, which significantly increases the stock price.
--- p.49
There are other favorable times to buy new stocks.
That's when a stock that has clearly been on the rise in the second stage returns to near the MA and undergoes several corrections.
Soon, the stock breaks above the resistance area again and rises. Buying stocks at the end of a correction near the MA is called "persistent buying."
Of course, there is a trade-off here too.
In this case, there is a very high possibility that a steep upward trend awaits, but there are also many risk factors.
This type of buying is more suitable for traders than investors.
--- p.97
Let's go back to Chart 4-1.
Let me explain why this stock is only a B-. When XYZ stock shows signs of strength, breaking above the resistance level of 15, you should look to see where the next resistance level will form.
The next resistance level will be 18, which was previously support.
Remember, once a support level is broken, it becomes a resistance level when the stock price rises. Even if XYZ stock breaks through this resistance level and rises, it will struggle to reach 20.
So, between 18 and 20 is likely to be the next resistance area.
Of course, that's not to say that stocks will never overcome this area.
But that requires enormous purchasing power.
So it's easy to stay in this area for a long time.
--- p.139
The second element to look at is the RS line.
This is a metric that distinguishes between "just good" stocks to buy and "very good" stocks.
In a chart pattern that could be a big fish, the RS line should be in the negative area or close to the zero line.
And when a breakout to level 2 occurs, the RS line should clearly move into the positive zone.
This is really important. As I mentioned earlier, if the RS line is steadily rising and all other factors are positive, you can buy the stock even if the RS line remains in negative territory.
However, when looking for a truly special big fish, there's no room for compromise. If the RS line remains in negative territory, even if the stock is a good buy and could generate decent profits, it won't be a big fish.
--- p.211
Okay, now focus.
When buying stocks, volume is very important when there is an upward breakout.
Never buy on a breakout that is not accompanied by significant volume.
If you buy a stock and there is no confirmed trading volume, you should sell the stock during the initial rise.
From a short selling perspective, it's completely different.
While it's nice to see a significant increase in volume and confirmation of a downtrend, volume isn't essential to winning a short position.
It takes force to raise a stock, but when a stock falls, it can fall under its own weight.
--- p.303
Now you can plan your game.
I hope you don't overlook the importance of planning.
If you follow my tactics and adhere to the rules I've outlined, you'll never find yourself in trouble like other investors.
Although double losses do occur occasionally, you don't have to worry about losing your invested money or losing your financial assets.
By diversifying your portfolio (both across individual stocks and industries) and using mechanical orders wisely instead of being stubborn, you can protect your assets. Even if you lose a small amount of your investment, it will only be a minor headache, not a financial disaster.
The important thing is that when you make a profit, you can achieve very satisfying results by hitting home runs rather than singles.
--- p.422
Publisher's Review
Black Monday in 1987
An investment predicted two months ago
On Monday, October 19, 1987, the Dow Jones Industrial Average (DJIA) on the New York Stock Exchange plummeted by a whopping 22.6% (508 points) in one day.
The daily decline, the world's largest, was even greater than "Black Thursday" on October 24, 1929, which sparked the Great Depression.
Stan Weinstein was a stock investor who foresaw the shock of that day, which was then called Black Monday.
Stan Weinstein used charts of stock prices and trading volume, and individual stock (individual fund) prices against the Dow Jones Industrial Average to inversely calculate the number of rising and falling stocks, thereby gaining insight into the market's strength.
Based on this, he had been blowing the trumpet of a full-scale retreat for two months before Black Monday broke out.
Those who sold their stocks after hearing Stan Weinstein's passionate appeal at a lecture successfully weathered the crash, and his chart analysis and investment forecasts proved to be exceptionally accurate, leading to his admiration for the past 33 years.
At the time, he was writing a book about his investment know-how, which was published on January 1, 1988, right after Black Monday.
The title is 《Stan Weinstein's Secrets For Profiting in Bull and Bear Markets》.
Since then, stock investors around the world have been reading this book as a scripture.
Optimal Buy/Sell Timings, Industry Outlook, Short Selling, Funds, Options, and Futures
How to interpret all stock trading with 'charts'
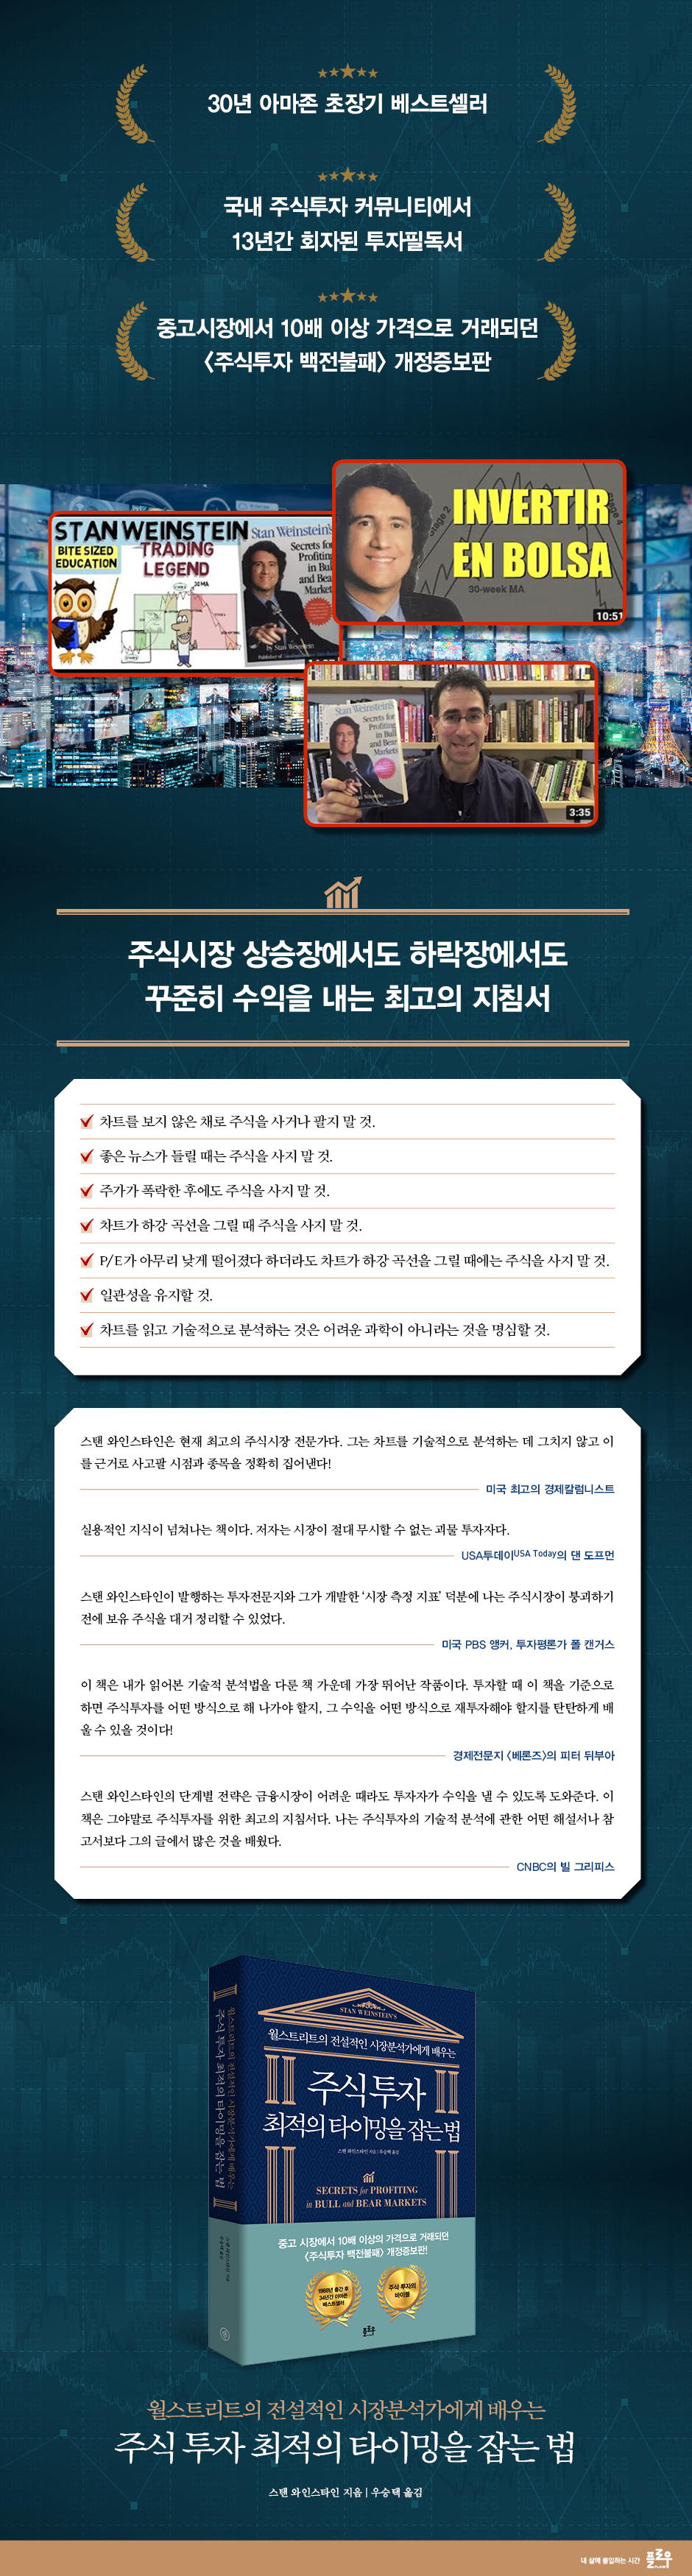
This book provides detailed explanations of familiar investment techniques, including optimal buy/sell timing, how to select an industry, short selling tips, and how to read indicators that indicate bull and bear markets.
But what makes this book special is that, like a classic in technical analysis, it applies all investment techniques and strategies to charts.
In particular, the four stages of the stock cycle view the flow of stock prices as stages 1 to 4, dividing them into the base area, rising phase, peak area, and declining phase, and applying buying and selling strategies to each.
After going through the basics of chart reading, such as how to read charts, the four stages of the stock cycle, and how to predict the market with charts, it teaches you how to select the individual industries with the highest profits, how to identify A+ stocks through chart analysis, how to read the optimal selling timing, and how to conquer the fund-options-futures markets.
Stan Weinstein, with 44 years of experience in the stock market, says, “You can see the market at a glance by looking at the charts.
“Because charts always send a message,” he emphasizes.
I confidently claim that I could have predicted every bull and bear market that occurred over the 15 years from 1973 to 1988.
The author, who has strong confidence in chart reading, claims that by reading charts, he can predict not only short-term ups and downs, but also long-term prospects, such as booms lasting several months or years, and sudden crashes.
This is why domestic stock investors have been reading and recommending this book for the past 13 years.
This book will serve as an excellent guide to mastering technical analysis and achieving successful investing.
An investment predicted two months ago
On Monday, October 19, 1987, the Dow Jones Industrial Average (DJIA) on the New York Stock Exchange plummeted by a whopping 22.6% (508 points) in one day.
The daily decline, the world's largest, was even greater than "Black Thursday" on October 24, 1929, which sparked the Great Depression.
Stan Weinstein was a stock investor who foresaw the shock of that day, which was then called Black Monday.
Stan Weinstein used charts of stock prices and trading volume, and individual stock (individual fund) prices against the Dow Jones Industrial Average to inversely calculate the number of rising and falling stocks, thereby gaining insight into the market's strength.
Based on this, he had been blowing the trumpet of a full-scale retreat for two months before Black Monday broke out.
Those who sold their stocks after hearing Stan Weinstein's passionate appeal at a lecture successfully weathered the crash, and his chart analysis and investment forecasts proved to be exceptionally accurate, leading to his admiration for the past 33 years.
At the time, he was writing a book about his investment know-how, which was published on January 1, 1988, right after Black Monday.
The title is 《Stan Weinstein's Secrets For Profiting in Bull and Bear Markets》.
Since then, stock investors around the world have been reading this book as a scripture.
Optimal Buy/Sell Timings, Industry Outlook, Short Selling, Funds, Options, and Futures
How to interpret all stock trading with 'charts'
This book provides detailed explanations of familiar investment techniques, including optimal buy/sell timing, how to select an industry, short selling tips, and how to read indicators that indicate bull and bear markets.
But what makes this book special is that, like a classic in technical analysis, it applies all investment techniques and strategies to charts.
In particular, the four stages of the stock cycle view the flow of stock prices as stages 1 to 4, dividing them into the base area, rising phase, peak area, and declining phase, and applying buying and selling strategies to each.
After going through the basics of chart reading, such as how to read charts, the four stages of the stock cycle, and how to predict the market with charts, it teaches you how to select the individual industries with the highest profits, how to identify A+ stocks through chart analysis, how to read the optimal selling timing, and how to conquer the fund-options-futures markets.
Stan Weinstein, with 44 years of experience in the stock market, says, “You can see the market at a glance by looking at the charts.
“Because charts always send a message,” he emphasizes.
I confidently claim that I could have predicted every bull and bear market that occurred over the 15 years from 1973 to 1988.
The author, who has strong confidence in chart reading, claims that by reading charts, he can predict not only short-term ups and downs, but also long-term prospects, such as booms lasting several months or years, and sudden crashes.
This is why domestic stock investors have been reading and recommending this book for the past 13 years.
This book will serve as an excellent guide to mastering technical analysis and achieving successful investing.
GOODS SPECIFICS
- Date of publication: December 7, 2020
- Page count, weight, size: 436 pages | 744g | 153*224*30mm
- ISBN13: 9791191228366
- ISBN10: 1191228363
You may also like
카테고리
korean


korean

![ELLE 엘르 스페셜 에디션 A형 : 12월 [2025]](http://librairie.coreenne.fr/cdn/shop/files/b8e27a3de6c9538896439686c6b0e8fb.jpg?v=1766436872&width=3840)


