

Steve Neeson's Candlestick Chart Investment Technique
 |
Description
Book Introduction
A masterpiece by Steve Neeson, a revolutionary in technical analysis.
《Japanese Candlestick Charting Techniques》 Complete!
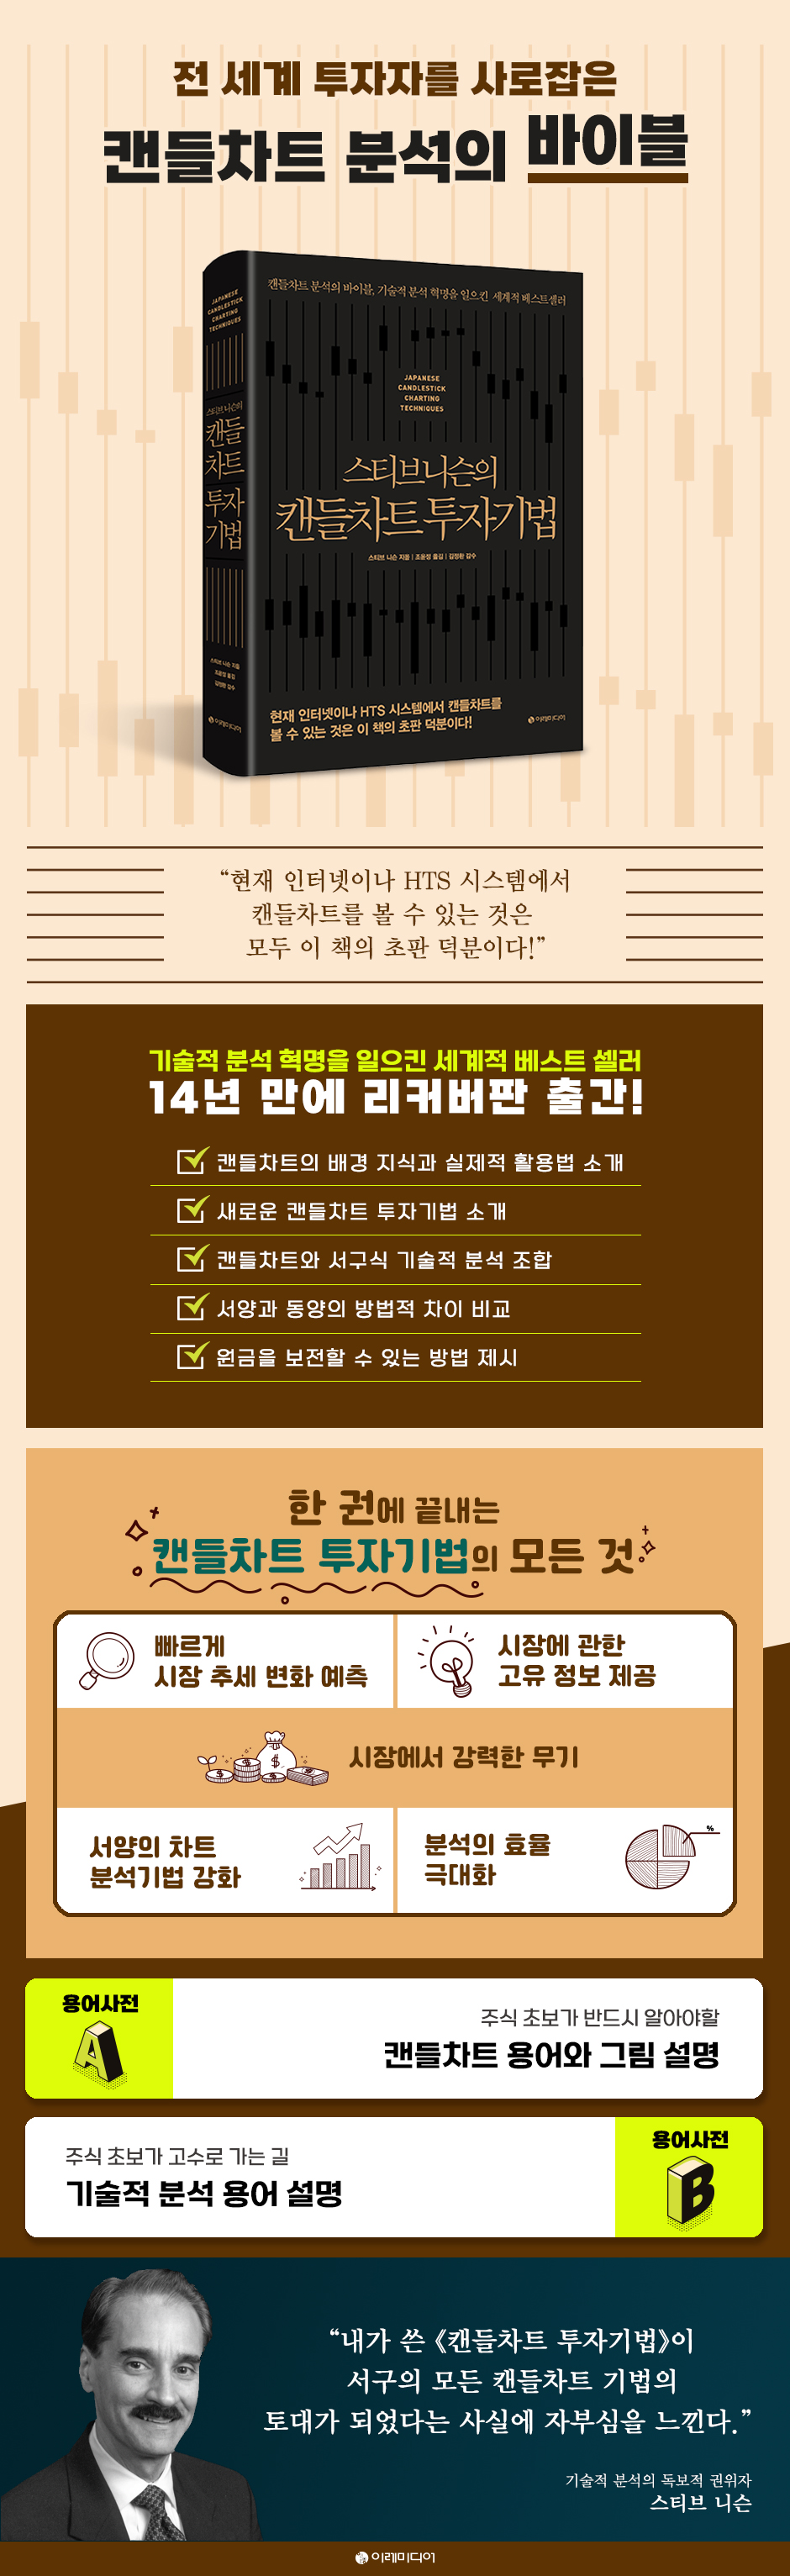
The translated version of "Japanese Candlestick Charting Techniques," considered the bible of candlestick chart analysis by investors around the world, has been republished after 14 years.
In this book, author Steve Neeson introduced the background knowledge and practical application of candlestick charts to the Western world for the first time.
This book, which sparked a candle chart syndrome among investors around the world after its publication, revolutionized the field of technical analysis to the point that candle charts are now available in all charting services worldwide.
Candlestick charts not only show the trend of stock price movements, but also, unlike bar charts, show the underlying forces behind stock price movements.
Because it provides early warning of changes in market trends, you can enter or exit the market at the right time.
In a market where even the slightest error is unacceptable, this book will serve as a guide for investors, providing them with precise timing.
《Japanese Candlestick Charting Techniques》 Complete!
The translated version of "Japanese Candlestick Charting Techniques," considered the bible of candlestick chart analysis by investors around the world, has been republished after 14 years.
In this book, author Steve Neeson introduced the background knowledge and practical application of candlestick charts to the Western world for the first time.
This book, which sparked a candle chart syndrome among investors around the world after its publication, revolutionized the field of technical analysis to the point that candle charts are now available in all charting services worldwide.
Candlestick charts not only show the trend of stock price movements, but also, unlike bar charts, show the underlying forces behind stock price movements.
Because it provides early warning of changes in market trends, you can enter or exit the market at the right time.
In a market where even the slightest error is unacceptable, this book will serve as a guide for investors, providing them with precise timing.
- You can preview some of the book's contents.
Preview
index
Recommendation
introduction
Acknowledgements
About the Author
Chapter 1.
preface
What's new in this book
Why candlestick chart analysis techniques have captured the attention of traders and investors around the world.
Who is this book for?
background
What does this book contain?
Things to watch out for
The Importance of Technical Analysis
Chapter 2: Historical Background
Part 1: Candlestick Chart Basics
Chapter 3.
Composition of candlestick charts
Candle structure
Chapter 4.
reversal pattern
Umbrella type
hammer type
hanging
Control type
Black cloud type
Penetrating
Chapter 5.
Star type
Morning Star
Seokbyeolhyung
Cross and star shapes and cross and stone shapes
Meteoroid and inverted hammer types
Meteoroid
Inverted hammer type
Chapter 6.
Other reversal patterns
Conception type
Cross of the Immaculate Conception
Clamp-type ceiling and floor
loincloth type
Crow type
Black Sambyeong
Three rising diseases
Samsan-hyeong and Samcheon-hyeong
Counterattack type
Meat dumpling-shaped ceiling and frying pan-shaped floor
Tower ceiling and tower floor
Chapter 7: Persistent Patterns
window
Tasuki type
High and low gapping play
Side-by-side
Ascending and descending three-way patterns
Fork in the road
Chapter 8.
Doge type
North-facing Doji (bull market doji)
Long-legged Doji (rickshaw puller), stone-shaped Doji, sleeping-shaped Doji
Three-star type
Chapter 9.
synthesis
Part 2.
convergence
Chapter 10.
Candle group
Chapter 11.
How to Use Trendlines on Candlestick Charts
Spring and upthrust
Principle of polarity change
Chapter 12.
How to Use Retracement Levels on Candlestick Charts
Chapter 13.
How to Use Moving Averages on Candlestick Charts
simple moving average
Weighted Moving Average
exponential moving average
How to Use Moving Averages
Chapter 14.
How to Use Oscillators on Candlestick Charts
relative strength index
How to calculate the relative strength index
How to Use the Relative Strength Index
Moving Average Oscillator
How to calculate the moving average oscillator
How to Use the Moving Average Oscillator
Stochastic
How to calculate stochastic
How to Use Stochastics
Moving Average Convergence/Divergence Index
How to calculate the moving average convergence/divergence index
How to Use the Moving Average Convergence/Divergence Index
Chapter 15.
How to Use Volume on Candlestick Charts
Chapter 16.
Measuring stock price fluctuations
Chapter 17.
Harmony of East and West: The Power of Convergence
conclusion
Glossary A
Candlestick Chart Terms and Figures Explained
Glossary B
Terminology of Western technical analysis
References
index
Detailed image
Into the book
The military circumstances that dominated Japan for centuries also permeate candlestick chart terminology.
If you think about it, trading requires many of the same skills as winning a war.
These skills include strategy, psychology, competition, strategic retreat, and of course, luck.
So, it won't be surprising if you encounter candlestick terminology reminiscent of war throughout this book.
“Morning attack”, “Night attack”, “Three enemy soldiers”, “Counterattack”, etc.
---From "Chapter 2 Historical Background"
Figure 4.13 is a rising engulfing pattern.
In the picture, the stock price was falling.
However, an upwardly trending candle appears and covers or swallows the body of the preceding negative candle (hence the name "capturing candle").
This pattern is sometimes called the hug pattern (or, if it's Valentine's Day, it might as well be called that).
Here we can see that the buying force overwhelmed the selling force.
---From "Chapter 4 Reversal Pattern"
The pincer type should be analyzed differently on the intraday chart, daily chart, weekly chart, and monthly chart.
In intraday or daily charts, even if the high or low prices are the same for two days or two units, it cannot be considered an important signal.
On intraday or daily charts, candles must meet strict criteria for a pincer pattern to be meaningful (either they must have the same high and low, form a certain candle pattern, or the first candle must be large and the second candle must be small).
In short, you need to carefully examine whether a special combination of candles is formed in the intraday or daily chart's pincer pattern.
---From "Chapter 6 Other Reversal Patterns"
Candlestick charts are a very powerful tool that are gaining popularity and are gradually replacing bar charts.
But I don't just use indicators on candlestick charts.
Candlestick chart analysis techniques are powerful on their own, but they can be even more powerful when combined with other chart analysis tools.
This is also an advantage of candlestick charts.
You can use candlestick chart techniques and Western technical analysis techniques together.
Experienced technical analysts will quickly discover that combining Japanese candlestick charting techniques with Western technical analysis techniques can yield remarkable synergy effects.
---From "Conclusion"
Publisher's Review
A masterpiece by Steve Neeson, a revolutionary in technical analysis.
《Japanese Candlestick Charting Techniques》 Complete!
The translated version of "Japanese Candlestick Charting Techniques," considered the bible of candlestick chart analysis by investors around the world, has been republished after 14 years.
In this book, author Steve Neeson introduced the background knowledge and practical application of candlestick charts to the Western world for the first time.
This is the book that sparked a candle chart syndrome among investors around the world after its publication and revolutionized the field of technical analysis to the point that candle charts are now available in all charting services around the world.
This book contains not only orthodox interpretations of chart patterns and techniques, but also a variety of previously unknown techniques.
Moreover, you can experience Steve Neeson's unique interpretation.
Neeson has taught this technique to professionals at virtually every major investment firm in 18 countries.
This led to his appointment as a Market Technical Analyst from the Certified Market Technical Analyst Association.
He has lectured at the Federal Reserve, the World Bank, and numerous universities.
He worked as a senior technical analyst at Merrill Lynch and as a senior vice president at Daiwa Securities.
He is currently working as a lecturer at the New York Institute of Finance.
He is the president of Candlecharts.com.
Currently, it is possible to view candle charts on the Internet or HTS system.
All thanks to the first edition of this book!
Although countless experts and investors talk about candlestick charts almost daily, you cannot truly understand candlestick charts without reading this book.
This is because almost all writings and discussions on candlestick charts originate from and are based on this book.
Steve Neeson says:
“I am proud of the fact that my book, Candlestick Chart Investment Technique, has become the foundation for all candlestick chart techniques in the West.
Before this book was published, who had ever heard of candlestick charts? And now, after this book, who can say they haven't heard of candlestick charts?"
I recommend this book to the following people!
_ Professionals who feel that there is a lack in providing candle chart analysis services to customers and want to make full use of it
_ From those who are new to candle charts to those who want to invest properly
_ People who want to enter or exit the market at a more appropriate time
_ People who want to get ahead in competition with others
- People who want to supplement their current trading tools with new techniques.
- People who want to have fun while learning
The secret that captivates traders and investors worldwide!
The greatest strength of this book is that it is written in a way that anyone can easily understand.
Candlestick charts are easy to use for everyone, from beginner chartists to veteran experts.
Additionally, the author provides unique insights into the market through this book.
Candlestick charts not only show the trend of stock price movements, but also, unlike bar charts, show the underlying forces behind stock price movements.
This increases the efficiency of analysis.
Looking at candlestick charts allows you to analyze the market faster and more efficiently thanks to the visual information you get immediately.
Because it provides early warning of changes in market trends, you can enter or exit the market at the right time.
This allows readers to gain a better understanding of the market and even achieve higher returns.
GOODS SPECIFICS
- Date of issue: January 30, 2022
- Format: Hardcover book binding method guide
- Page count, weight, size: 376 pages | 914g | 170*235*30mm
- ISBN13: 9791191328455
- ISBN10: 1191328457
You may also like
카테고리
korean


korean

![ELLE 엘르 스페셜 에디션 A형 : 12월 [2025]](http://librairie.coreenne.fr/cdn/shop/files/b8e27a3de6c9538896439686c6b0e8fb.jpg?v=1766436872&width=3840)


