

Practical Chart Pattern 63
 |
Description
Book Introduction
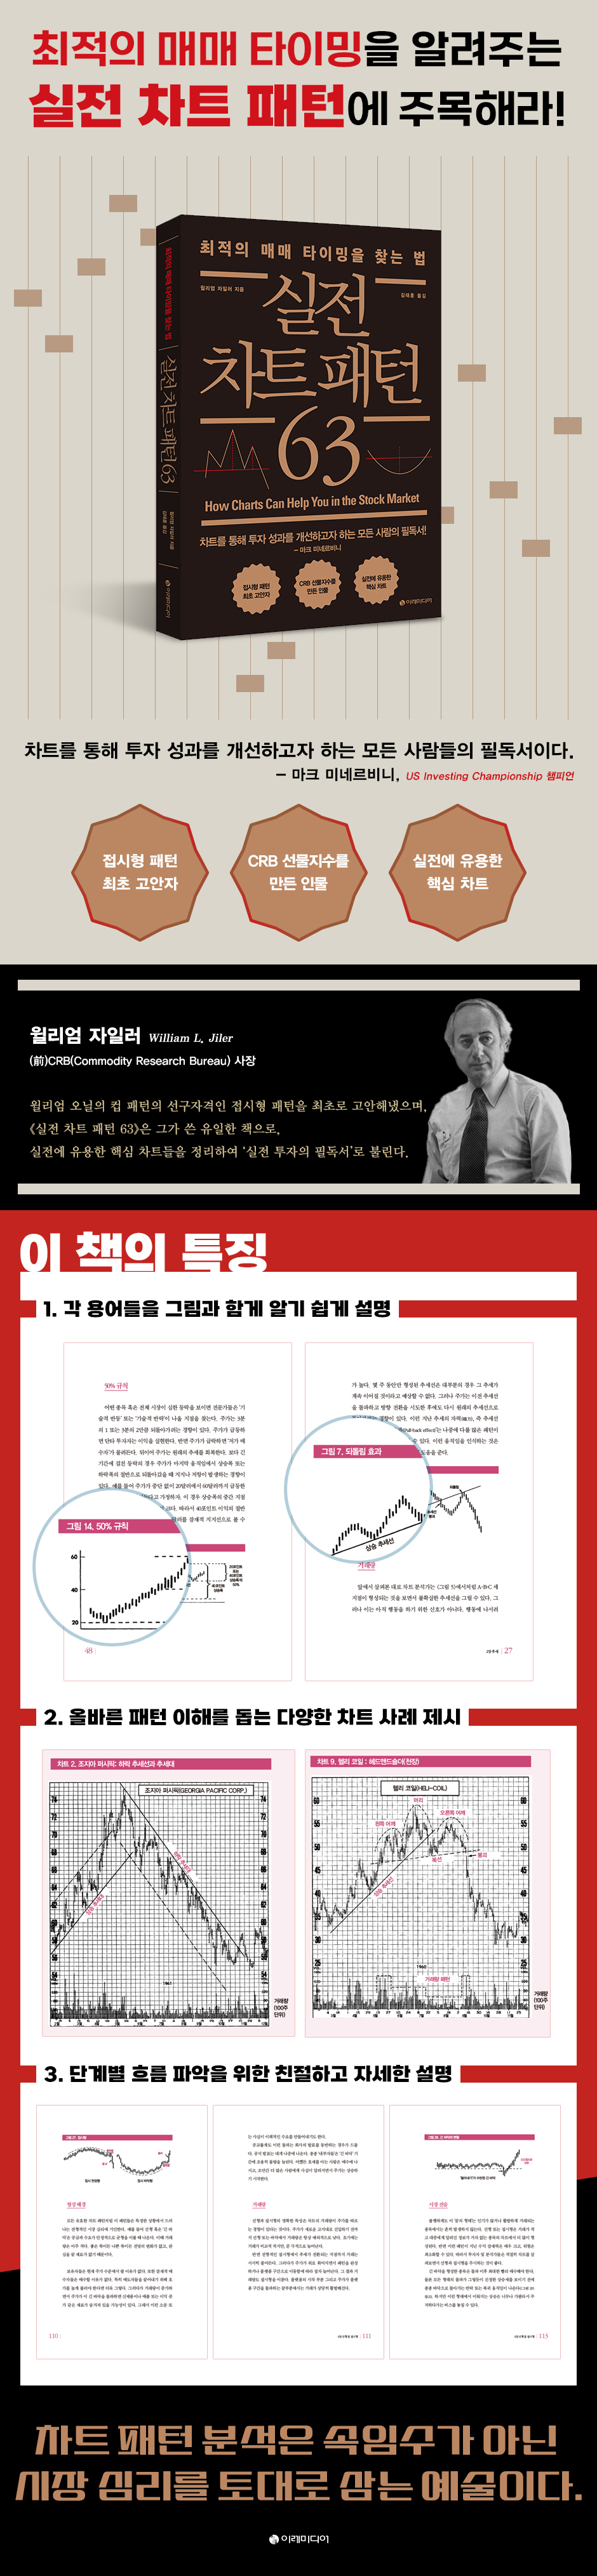
Find the rising and falling charts!
William Zeiler, founder of the CRB futures price index
Designed to capture the optimal trading timing over a long period of time
63 Practical Key Charts!
William Seiler developed CRB's futures chart service, trendline chart service, and CRB futures price index, and is the person who first created the saucer pattern, a precursor to William O'Neil's cup pattern.
Incidentally, the CRB Futures Price Index, created by William Zeiler, immediately became the dominant indicator of overall price activity in the stock market, and even now, more than 60 years after its introduction, it remains an essential benchmark for measuring global commodity price movements.
The greatness of the saucer pattern is proven by William O'Neil's 40% annual return.
"63 Real Chart Patterns" is the only book written by William Zeiler, published in 1962 and used by countless traders.
That's why this book is called a classic in technical analysis and a must-read for practical investment.
Although this book was published over 60 years ago, it remains as fresh and relevant as the day it was first printed.
Because the 63 chart patterns he researched and devised are still valid today.
Chart patterns such as trends, support and resistance lines, double tops and bottoms, linear and dish patterns, V-shaped patterns, swing patterns, triangle patterns, continuation patterns, reversal days and gaps, islands, traps, market averages, and the 200-day moving average can help you predict which direction a stock will move and where it will stop.
For a new generation of investors, this book will be a must-read to help them achieve profitability.
- You can preview some of the book's contents.
Preview
index
Acknowledgements
Introduction
Chapter 1 Tools for Investors
Chapter 2 Trends
Chapter 3 Support and Resistance Lines
Chapter 4 Head and Shoulders
Chapter 5 Double Ceiling and Double Floor
Chapter 6 Linear and Dish-Shaped
Chapter 7 V-shaped
Chapter 8 Swing Patterns
Chapter 9 Coil (or Triangle)
Chapter 10: Continuation Patterns
Chapter 11: Reversal Day, Gap, and Island
Chapter 12 Trap
Chapter 13 Market Average Index
Chapter 14 Other Indicators
Chapter 15 200-day moving average
Chapter 16 Profit
Chapter 17: Pitfalls and Benefits
Detailed image
Into the book
What is clear is that the longer a stock moves along a particular trend or within a particular trend zone, the more likely it is that the trend is stronger.
Therefore, trend lines on long-term charts, such as weekly or monthly high, low, and close charts, are usually more reliable than trend lines formed on daily high, low, and close charts.
A trend line that has been formed for only a few weeks is usually not expected to continue.
However, even after a stock price breaks through a previous trend line and attempts a change in direction, it tends to return to the original trend line.
This magnetic force of past trends, or the 'pull-back effect' of trend lines, can be observed in the process of completing many patterns that will be discussed later.
Recognizing these movements helps you time your buys and sells.
---From "Chapter 2 Trends"
Even in the short term, the highs and lows of stock price fluctuations have a psychological impact on investors, and small support and resistance levels are formed accordingly.
For example, let's say you own a stock that is going up and you just decided to sell.
But suddenly the stock price starts to fall from the record high.
In this case, don't you feel like you've missed a golden opportunity to "sell the ceiling"? Also, wouldn't you want to get out if the stock price rebounds to its all-time high while you're pondering it? If many buyers feel this way, this peak becomes a strong resistance level.
Even if you get there with very little trading volume at first.
---From "Chapter 3 Support and Resistance Lines"
Let me emphasize again that 'head and shoulders' is a very abstract and imaginative term for a pattern of market behavior.
As with all behavioral patterns involving people and other unpredictable elements, the shape of the chart does not follow a strict formula.
Sometimes the head appears as a flat 'sideways stagnation zone' rather than a point or curve.
Also, sometimes the shoulders become deformed and the balance between the two sides becomes unbalanced.
And sometimes a compound head and shoulders pattern is formed.
That is, a small pattern may be contained within a large pattern, or there may be two left shoulders, two heads, or two right shoulders.
People who pay a fortune for Picasso paintings won't be surprised by this sight.
---From "Chapter 4 Head and Shoulders"
A normal volume pattern for a double top is a marked increase in volume near each high.
However, the important fact is that studying valid double tops and double bottoms has revealed significant changes in trading volume patterns.
For example, volume may be low at one high point and high at another.
In fact, some strong highs and lows are formed with unusually low volume.
The best rule is this:
An unusual change in volume, such as a significant decrease in volume near one or two highs, can confirm the development of a double top or double bottom.
---From "Chapter 5 Double Ceiling and Double Floor"
In other reversal patterns, buyers and sellers bid for control over a relatively long period of time.
During this period, one group takes turns leading the situation.
The interaction of these two forces foreshadows a market reversal and alerts chart analysts to the possibility.
But the V-shape is different.
As the name suggests, there is no room for preparation in the V-shaped case.
Unlike other reversal patterns, there is no gradual change from a downtrend to an uptrend.
The V-shaped transition comes without warning.
Dramatic and decisive.
As if all the stocks sold by sellers were suddenly disposed of according to a predetermined signal, buyers rushed to buy them all at once.
It doesn't seem like they'll take the initiative.
---From "Chapter 7 V-Shape"
A correction in a swing pattern can be due to profit taking, short selling, or any other factor that is holding back the trend.
Also, explaining why the second interval is almost identical to the first would require advanced statistics or psychology.
Perhaps it's because in every up and down move, half the distance traveled tends to be returned (the 50% rule).
For whatever reason, there is a close correlation between the first and second parts of the swing pattern.
Chart analysts should take advantage of this.
---From "Chapter 8 Swing Patterns"
Breakouts from tight box, flag, and pennant patterns are very reliable signals of future trends.
These usually indicate the direction in which the stock price will move ahead of fast and wide movements.
For this reason, some short-term investors act only on this signal.
Patterns that are not necessarily reliable, but still more reliable than others, are loosely constructed boxes, pennants, and all wedges and diamonds.
Such patterns help confirm other signals of larger trend developments.
It is also useful for identifying support and resistance lines and good buy or sell points.
---From "10 Continuity Patterns"
Investors and analysts should consider all the unusual phenomena covered in this chapter, such as one- or two-day reversals, gaps, islands, and boom days, as "warning signals."
Of course, each case must be considered within the overall framework of the chart.
It includes trend lines, support and resistance lines, and reversal patterns.
The specific circumstances of each situation determine whether to buy or sell.
So, we cannot present immutable laws.
But on the other hand, warning signs should not be ignored.
Some historical examples that follow demonstrate how important this warning is.
---From "Chapter 11: Reversal Day, Gap, Island"
Analysts call these situations "Bull Traps" and "Bear Traps," depending on which type of trader they trap.
Basically, a bull trap occurs when a stock forms a relatively narrow range near its high for a period of time.
At this time, the stock price breaks through the trading range, rises to a new high, and then suddenly falls to the low (support line) of the previous trading range.
Then, the 'bullishers' (or those who bought in the last rising or trading section) are caught with losses.
---From "Chapter 12 Traps"
Publisher's Review
Find the chart that makes money!
Developed the CRB futures price index and the dish pattern
William Seiler's only book!
William Zyler may be an unfamiliar name to stock investors.
Not many people have mentioned him, and only one of his books has been published in the world.
However, despite his relative obscurity in Korea, William Zyler has left a significant mark on the stock market over his 25-year career as a professional investment advisor and chart analyst.
He worked for Standard & Poor's Trendline for many years and also served as president of the Commodity Research Bureau (CRB), which was founded by his brother Milton in 1934.
During this period, he developed CRB's futures chart service, trendline chart service, and the CRB Futures Price Index, which immediately became the dominant indicator of overall price activity in the commodity markets and remains an essential benchmark for measuring global commodity price movements more than 60 years after its introduction.
He also pioneered the saucer pattern, a precursor to William O'Neill's cup pattern, and pioneered the compilation of core charts useful in practice. This book is the result of his extensive research and development.
63 patterns to reduce the risks inherent in investing
Know-how for real investment!
William Seiler is said to have called the dish-shaped pattern he created “the dream pattern.”
Mark Minervini agreed, commenting that it was easy to understand and reliable.
This is also a comment that summarizes this book.
William Zeiler also invented chart patterns to reduce the risks inherent in investing.
In particular, this book contains easy-to-understand and reliable chart patterns, backed by detailed explanations that provide practical inspiration to investors.
For example, rather than just mechanically explaining chart patterns, it explains in detail how the movement of trading volume changes depending on breakouts, breakout failures, and failures of tricks, etc.
This cannot but be valuable information for practical investors.
This book was written in 1962.
Since technical analysis was not common at the time, the chart patterns he devised had to stand the test of time.
And finally, as time passed, it was made known to the world by William O'Neill and Mark Minervini.
This is why it is considered a classic in technical analysis and a must-read for practical investment.
This book presents 63 easy-to-understand and reliable patterns, as Mark Minervini explains.
This book also teaches you how to spot trends, what the signals of a trend reversal are, and how to predict which direction a stock will move and where it will stop using chart patterns such as support and resistance lines, double tops and double bottoms, linear and dish patterns, V-shaped patterns, swing patterns, triangle patterns, continuation patterns, reversal days and gaps, islands, traps, market averages, and 200-day moving averages.
If you are familiar with technical analysis, the patterns in this book will not seem entirely unfamiliar.
Still, it contains many patterns, so it will be enough to provide a sense of freshness.
On the other hand, if you are just starting out with technical analysis, this will be an invaluable book that will help you make profits.
GOODS SPECIFICS
- Publication date: August 16, 2022
- Page count, weight, size: 284 pages | 518g | 152*225*18mm
- ISBN13: 9791191328592
- ISBN10: 1191328597
You may also like
카테고리
korean


korean

![ELLE 엘르 스페셜 에디션 A형 : 12월 [2025]](http://librairie.coreenne.fr/cdn/shop/files/b8e27a3de6c9538896439686c6b0e8fb.jpg?v=1766436872&width=3840)


