

Never invest in stocks without understanding technical analysis.
 |
Description
Book Introduction
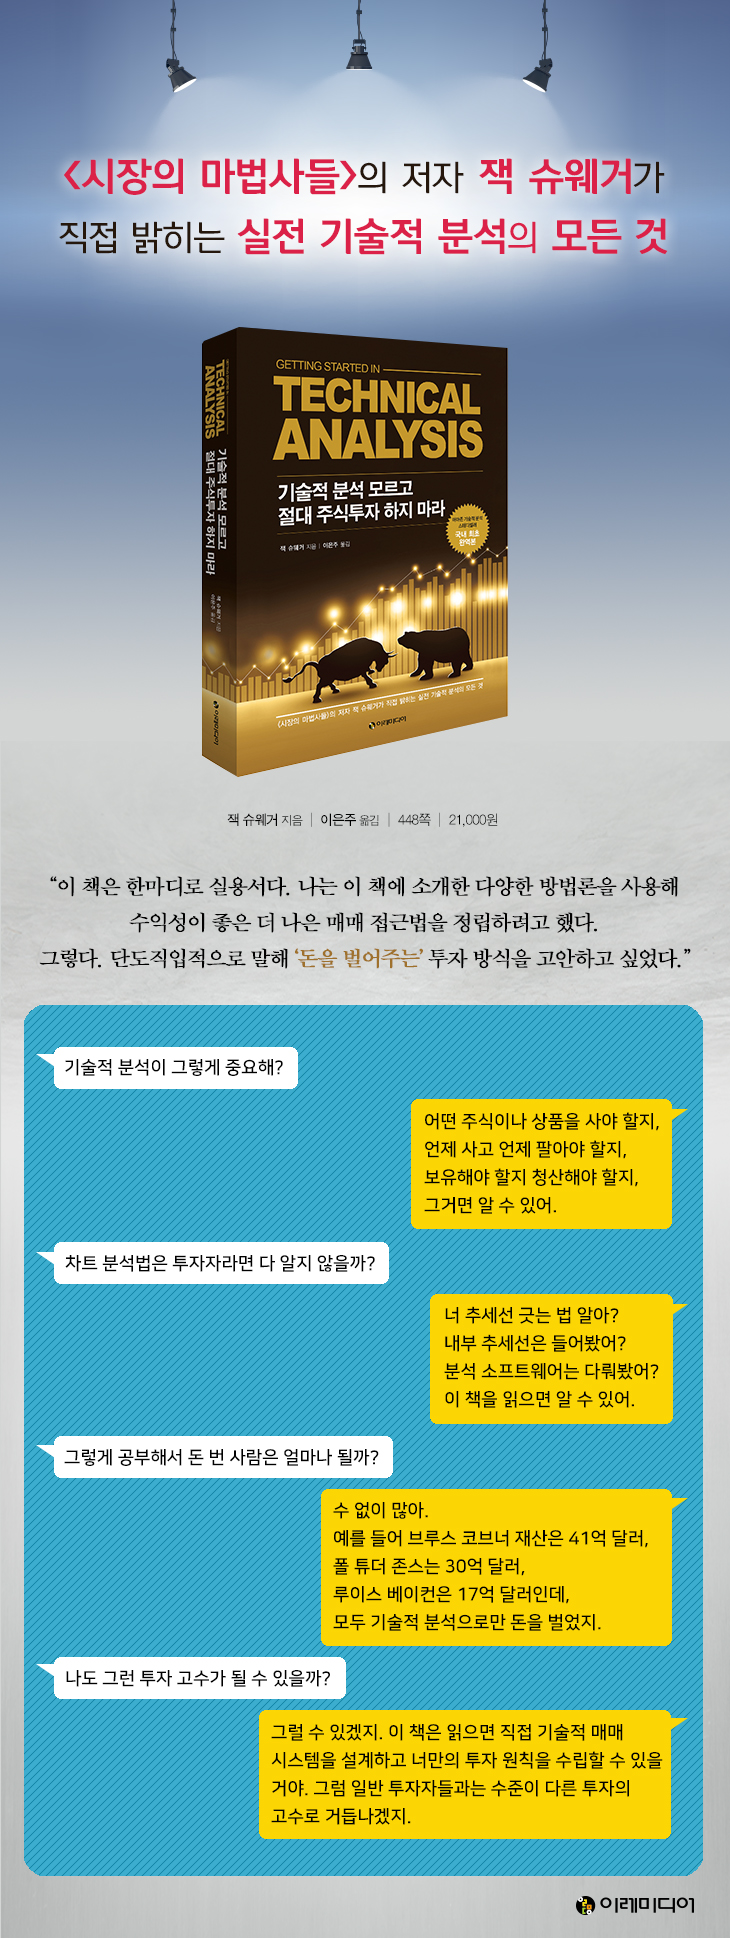
Jack Schwager, author of "Market Wizards," reveals everything you need to know about practical technical analysis.
Jack Schwager, a futures and hedge fund expert and author of numerous bestsellers including "Market Wizards," reveals the concepts and techniques of technical analysis he's learned through practice and experience! This book easily explains technical analysis concepts and theories, including trends, ranges, chart patterns, stop-losses, entry points, position liquidations, and the pyramiding approach.
The author explains the concepts and presents charts from his own trading, helping readers make better investment decisions while also providing the foundation for a mechanical trading system.
Additionally, the author generously shares 82 useful trading rules and 42 trading principles, along with market analysis information accumulated through decades of practical trading experience, to help readers reduce failure and achieve success.
- You can preview some of the book's contents.
Preview
index
introduction
Introduction - Technical Analysis and Its Controversies
Part 1: Basic Analysis Tools
Chapter 1: Charts: Forecasting Tools or Old-Fashioned Antiques Disguised as Tradition?
The debate between random walk theorists and chart analysts
Advantages of Investing Using Charts
Chapter 2 Types of Charts
bar chart
Closing price chart
P&F chart
candle chart
data
① Things Stock Investors Should Consider: Stock Splits and Price Data
② Things to Consider for Futures Investors: Linked Futures Contract Charts
Chapter 3 Trends
Identify trends with highs and lows
Trend line rules
Draw a trend line
Internal trend line
moving average
Chapter 4 Box Rights and Support and Resistance
Considerations When Investing in Box Rights
Break through the box
Support and resistance
Previous major highs and lows
Concentration of relative highs and relative lows
envelope bands
Chapter 5 Chart Patterns
Daily Patterns
① Gap ② Spike ③ Reversal day ④ Thrust day ⑤ Large-scale day
persistent pattern
① Triangle ② Flag and pennant shapes
Ceiling type and floor type
① V-shaped (floor type) and inverted V-shaped (ceiling type) ② Double ceiling type and double floor type ③ Head and shoulder type ④ Round ceiling type and round floor type ⑤ Triangle ⑥ Wedge type ⑦ Island-shaped inverted type
Chapter 6 Oscillators
Oscillators and Momentum
Basic oscillator
Overbought, oversold, divergence
conclusion
Chapter 7: Are Chart Analysis Techniques Still Effective?
① Risk management ② Confirmation conditions ③ Understanding chart patterns in the overall context
④ Understanding fundamental analysis ⑤ Utilizing false signals
Part 2 Key Investment Issues
Chapter 8: Market Entry and Pyramiding During a Trend
Entry strategy during a trend
① Retracement ratio ② Small rebound reversal ③ Continuation pattern and box breakout ④ Price rebound from long-term moving average
Chapter 9: Choosing a Stop-Stop Point
Stop-loss timing selection strategy
① Trend line ② Box ③ Flag and pennant ④ Big change ⑤ Relative high and relative low
Chapter 10: Target Setting and Other Position Liquidation Criteria
Target based on chart
Calculating price targets
Support and resistance lines
Overbought/Oversold Indicator
opposing opinion
Pursuit station designation
Changes in market opinion
Chapter 11: The Most Important Rules of Chart Analysis
False or misaligned signal
Bullish Trap and Bearish Trap
Trend line break false signal
Gap filling
Return to the spike peak
Return to the extreme of the same magnitude
Breakout of a flag or pennant pattern that is the opposite of what was expected
A reverse breakout after a normal breakout in a flag or pennant pattern.
Breakthrough in ceiling and floor types
Breakout of a round pattern
Reliability of false signals
conclusion
Chapter 12: Practical Chart Analysis
How to effectively use the contents of this chapter
Real-world chart analysis
Part 3 Trading System
Chapter 13 Chart Creation and Analysis Software
Types of pricing data
Considerations When Purchasing Software
Sources of information about software
Chapter 14: Technical Trading Systems: Structure and Design
About the trading system
Advantages of Mechanical Trading Systems
Three basic systems
Trend following system
① Moving average system ② Breakout system
10 Common Problems with Basic Trend Following Systems
Improvements to the basic trend-following system
① Confirmation conditions ② Filter ③ Adjustment according to market characteristics ④ Differences between buy and sell signals ⑤ Pyramiding ⑥ Trading liquidation
Countertrend system
① General considerations related to countertrends ② Types of countertrend systems
diversification
10 Problems with Basic Trend Following Systems and Their Solutions
Chapter 15: Verification and Optimization of the Trading System
Cases selected from only the best
Basic concepts and definitions
Selection of price data
Select verification period
realistic assumptions
System Optimization
Validation vs. Fitting
① Blind simulation ② Average performance of parameter combinations
The Truth About Simulation Results
Verification of multi-market systems
negative results
Design and verification stages of the trading system
About system verification software
A look at the trading system
Part 4: Practical Investment Guidelines
Chapter 16: A Systematic Trading Approach
Step 1: Establishing Investment Principles
Step 2: Choose a Market to Invest in
① Suitability of trading approach ② Diversification ③ Volatility
Step 3: Developing a Risk Management Plan
① Maximum risk limit per trade ② Stop-loss strategy ③ Diversification ④ Leverage reduction in highly correlated markets ⑤ Adjustment according to market volatility ⑥ Leverage adjustment according to asset fluctuations ⑦ Adjustment of loss period
Step 4: Implementing Your Investment Plan
Step 5: Write an Investment Note
Step 6: Keep an investment journal
Step 7: Analyze Your Investment
① Investment analysis broken down by category ② Asset chart
Chapter 17: 82 Trading Rules and Market Observation
Investment initiation
Trading Clearing and Risk Management
Other risk management rules
Maintain and liquidate profitable positions
Other principles and rules
market patterns
Analysis and Review
Chapter 18: The Magical Secrets of Trading
42 Trading Principles for Successful Investing
Appendix - Additional Concepts and Formulas
Coefficient of restitution
relative strength index
Strong trend
Spike Day Formula
Stochastic
Participation price range and average participation price range
Weighted Moving Average
Same thing as Daebyeon
Glossary of terms
Detailed image
Into the book
The traditional view sees fundamental and technical analysis as diametrically opposed concepts, but contrary to the beliefs of extreme extremists, in principle the two are closely related.
Technical analysts generally do not deny the validity of fundamental analysis elements.
They simply believe that fundamental analysis factors are captured and reflected in the price information.
Therefore, I believe that the best way to understand the impact of fundamental analysis factors on market trends is to analyze prices.
The biggest difference between these two approaches is that fundamental analysis is concerned with the reasons for market trends, while technical analysis is concerned with timing.
--- From the "Preface"
Most investors who have never used chart analysis techniques are extremely skeptical of this approach.
Here are some examples of problems that skeptics point out:
"Can such a simple technique really work?", "Since investors already know most chart analysis techniques, can't they use it in reverse?", "Is this still useful now that we already know most of the information about technical analysis techniques?" These questions are fundamentally valid.
However, there are many reasons why chart analysis remains an effective approach.
--- Chapter 7.
From "Are Chart Analysis Techniques Still Effective?"
Novice investors tend to ignore false signals and hold onto existing positions despite significant losses in the vain hope that things will improve.
Experienced investors have learned the importance of asset management and will liquidate their positions as soon as they determine that they have lost money.
A true investment expert will reverse a losing position when he detects an error in market movements.
In short, it takes considerable training and experience to properly utilize false signals.
And this flexibility is essential to using chart analysis effectively.
--- 「Chapter 11.
From “The Most Important Rules of Chart Analysis”
We often come across flyers advertising systems that claim to deliver annual returns of 200%, 400%, or even 600%.
Is the claim in this flyer true? My answer to that question is, "It can't be."
The key here is that since you're tinkering with past data after the fact, you can practically create any type of performance data.
Any trading program or system based on truly 'realistic' simulations should be a bit disconcerting, with results that are laughably poor compared to the typical advertising claims.
--- 「Chapter 15.
From “Verification and Optimization of Trading Systems”
Most investors only "rediscover the value" of this advice after making countless mistakes.
It's sad, but this is the harsh reality.
Therefore, I can confidently say that the trading rules and advice presented in this and the following chapters will help most investors avoid making fundamental mistakes.
The 82 trading rules introduced in this chapter are based on my personal experience.
Therefore, rather than accepting it unconditionally, I hope you will digest it on your own according to your own perspective.
--- 「Chapter 17.
From "82 Trading Rules and Market Observation"
From "82 Trading Rules and Market Observation"
Publisher's Review
Never Invest in Stocks Without Understanding Technical Analysis! Korea's First Complete Translation
“One evening, I was having dinner with a fundamental analyst and I dropped a knife on the table.
Coincidentally, the knife ended up stuck in the man's shoe.
But the man saw the sword spinning in the air and falling towards his feet.
I just stared blankly.
I screamed in surprise.
"Oh, why didn't you avoid it?" he asked. "Then the man replied,
I was waiting for the knife to bounce back.
“Now that we’ve come down, why don’t we go back up?”
- Ed Seykota
This book is about technical analysis.
Although many books on technical analysis have been published, this book is considered one of the few masterpieces in the field.
In Korea, it was introduced a long time ago under the title, "Never Invest in Stocks If You Can't Do Technical Analysis," but it was only a compilation, and this is the first time it has been introduced in its entirety.
The author of this book, Jack Schwager, is a futures and hedge fund expert and a famous author in Korea with many bestsellers, including the "Market Wizards" series.
He spent 22 years leading futures research at several of Wall Street's top investment firms, co-managed a CTA for 10 years, and was a partner at Fortune Group, a hedge fund advisory firm based in London.
He is the co-founder of FundSeeder.com, an internet-based technology business that connects trading talent with investment capital, co-portfolio manager of ADM Investor Services Diversified Strategies Fund, a futures and FX margin trading investment firm, and an advisor to Marketopper Securities, an India-based quantitative investment firm.
Jack Schwager explains his purpose for writing this book:
“In a word, this book is a practical book.
I use the various methodologies introduced in this book.
I was trying to establish a better trading approach that would be more profitable.
Yes, that's right.
To put it bluntly, I wanted to devise an investment method that would 'make money.'
Technical analysis is the 'science' that increases your odds of winning!
Author Kim Jeong-hwan, author of the best-selling book "Chart Technology," says in his book that technical analysis is "the language of the market."
In other words, the first thing you need to know to invest in stocks is to learn the language that will allow you to understand the market, and technical analysis is that language.
Technical analysis is a fundamental tool for investors to read and interpret the markets, listen to what they have to say, and communicate effectively.
How do you know which stocks or commodities to buy, when to buy and when to sell, whether to hold or liquidate, and whether the market is bullish, bearish, or sideways? Investors can figure this out through technical analysis.
Technical analysis also provides various tools for investors to understand and analyze the market, such as box ranges, support and resistance, breakouts, trends, drawing correct trend lines, ups and downs, effective moving average selection and slope, golden cross, death cross, gaps, trading volume, patterns, stop-loss, stop-loss lines, water riding, fire riding, pyramiding, head and shoulders, inverse head and shoulders, various oscillators, etc.
Investors can also use these technical analysis elements to develop their own investment techniques, i.e., trading systems suited to the market and the situation, and generate profits through high-probability stock trading.
Jack Schwager refers to this market language as “chart analysis as a tool for acquiring ‘common sense’ in investing.”
Before you start investing, if you thoroughly review past price charts and can predict market trends probabilistically, you can avoid some of the traps that beginners often fall into.
"Never Invest in Stocks Without Understanding Technical Analysis" clearly explains the basic concepts so that novice investors can utilize technical analysis, which can be difficult to understand. It also explains chart analysis that utilizes complex tools and how to design and utilize trading systems in an easy-to-understand manner.
It also explains how charts and trading systems can be applied to real-world investing, what works and what doesn't in practice, and how to design and test trading systems to maximize future performance.
This book provides detailed, user-friendly content for beginners and intermediate learners alike, with ample resources! I especially recommend this book to anyone who has read "Chart Technology" as a review and in-depth course.
Introducing all the techniques of technical analysis for practical investors.
- Know when to exit before you start investing!
I can't help but laugh when I hear someone say, "I've never seen a rich technical analyst."
This is an absurd statement that is reminiscent of the arrogance of an outsider.
I've been doing fundamental analysis for nine years, but I've actually made my money with technical analysis.
-Marty Schwartz
Technical analysis provides extremely useful tools for entry and exit, short selling and redemption, and trend continuation.
Jack Schwager emphasizes the importance of identifying the exit point before investing, especially through technical analysis.
Investors who do not set a stop-loss point in advance will be dragged along, unable to liquidate losing positions.
Moreover, if you lack these rules when investing, you may lose all your earnings in a short period of time and your losses may snowball in an instant.
This book presents 82 trading rules and 42 trading principles, enabling readers to learn appropriate market strategies. It also highlights the strengths and weaknesses of each indicator, as well as potential pitfalls for some indicators, helping beginners avoid potential pitfalls.
He also emphasizes helping people develop critical thinking and a trading style that suits their individual personality and risk tolerance.
This will be helpful not only to those interested in creating technical trading systems for day trading, but also to those looking to integrate technical analysis into other programs.
Specific and unique analysis tools you won't find anywhere else
- Learn the framework and flow of technical analysis learned through extensive practical experience.
"Never Invest in Stocks Without Understanding Technical Analysis" consists of 18 chapters in 4 parts.
Part 1, "Basic Analysis Tools," explains chart analysis tools, concepts, and methods, including charts, chart types, trends and trend identification, box ranges, how to read highs and lows, various chart patterns, and oscillators.
Part 2, "Key Investment Issues," explains entry strategies during a trend, strategies for selecting stop-loss points, strategies for setting targets and liquidating positions, and important rules for chart analysis. Chapter 12 then presents 20 practice problems for analyzing charts, allowing readers to identify and evaluate reasons for entering positions.
These are charts that the author actually used for trading, and examples of both successful and failed trades are provided.
Part 3, "Trading Systems," explains the pros and cons of technical trading systems and covers trend-following systems, counter-trend systems, and diversification in detail.
It also guides you through the process of designing, validating, and optimizing a trading system.
Part 4, "Practical Investment Guide," covers investment principles, investment markets, risk management plans, investment notes and journal writing, and investment analysis methods in detail, enabling investors who have mastered the basic concepts to approach systematic trading.
The author introduces 82 trading rules and 42 trading principles that lead to successful investing, acquired through extensive investment experience.
“Investing isn’t everything in life.
“There are more important things in our lives than investing.”
- Jack Schwager
GOODS SPECIFICS
- Date of issue: September 10, 2019
- Page count, weight, size: 448 pages | 900g | 170*235*28mm
- ISBN13: 9791188279593
- ISBN10: 1188279599
You may also like
카테고리
korean


korean

![ELLE 엘르 스페셜 에디션 A형 : 12월 [2025]](http://librairie.coreenne.fr/cdn/shop/files/b8e27a3de6c9538896439686c6b0e8fb.jpg?v=1766436872&width=3840)


