

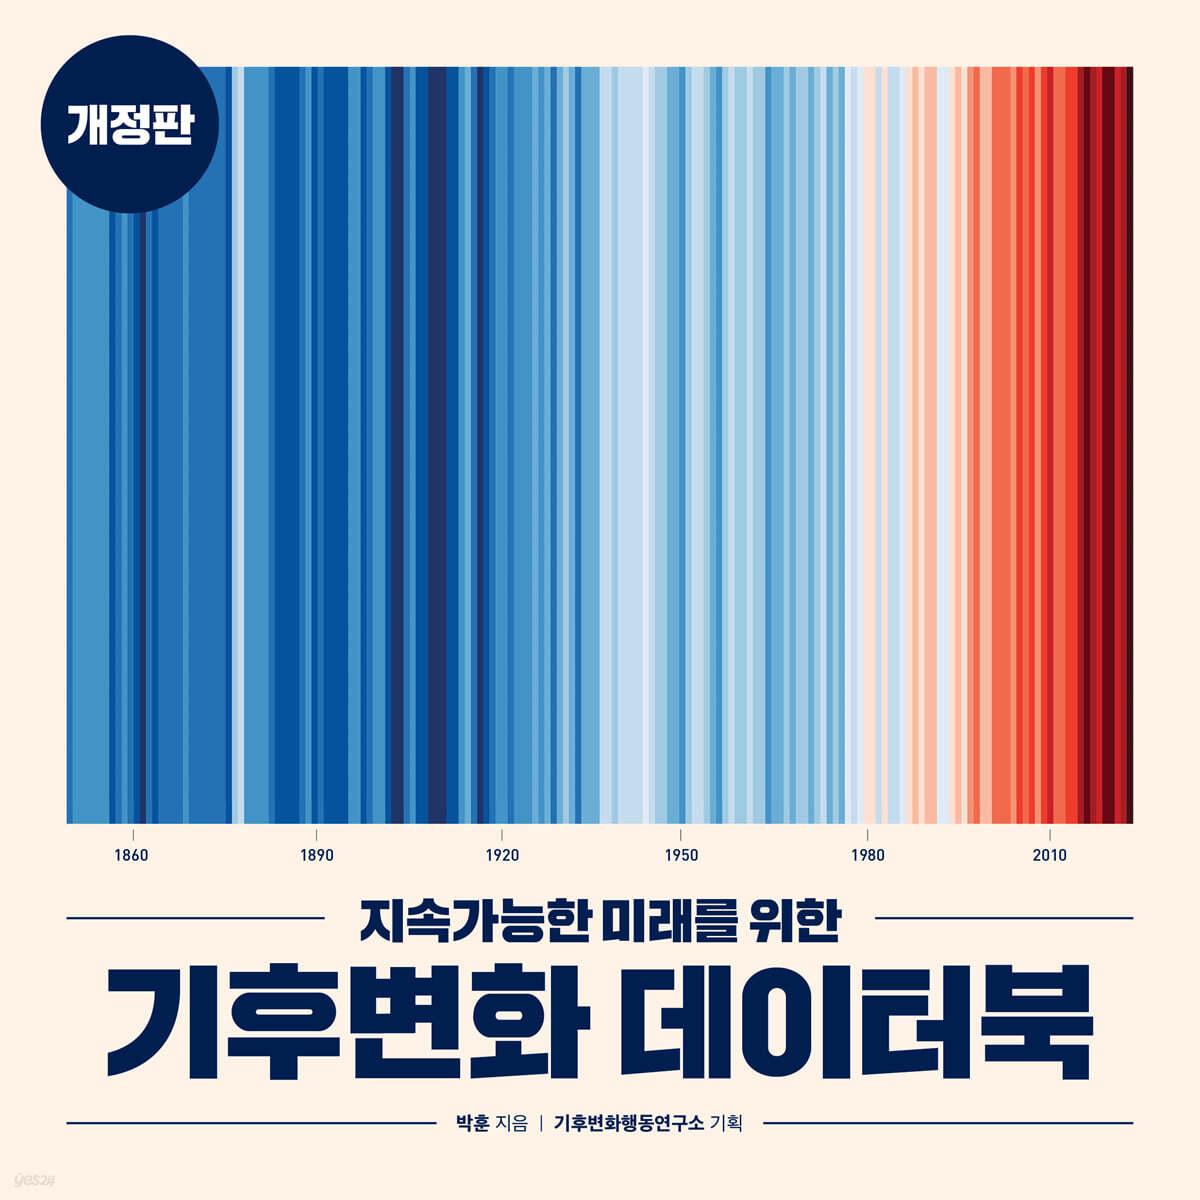
Climate Change Databook for a Sustainable Future
 |
Description
Book Introduction
The latest climate change data you need to know now!
In this age of climate crisis, the Climate Change Databook, which contains the latest climate change data we all need to know, was first published in 2021.
Since then, the climate has changed so rapidly that the term "up-to-date data" has become meaningless, and graphs representing climate change have had to be adjusted to become steeper.
Unfortunately, it's not for the better.
With signs of global warming, such as high temperatures and guerrilla-like torrential rains, occurring repeatedly around the world, everyone is now talking about the dangers of climate change.
Even in our country alone, unprecedented climate change and resulting disasters are becoming a daily occurrence.
A lot has changed in just a few years.
"How did this climate crisis arise, and how and how quickly must we change to overcome it?" The data needed to answer the questions posed in this book three years ago have also changed, so a revised edition of the "Climate Change Databook" has been published to reflect the changes in climate change data.
- You can preview some of the book's contents.
Preview
index
Preface to the Revised Edition
In publishing the book
I.
Climate Crisis Status
01.
How much has the Earth warmed exactly?
02.
What is the remaining carbon budget as of January 1, 2023?
03.
Our country's average surface temperature has risen by 0.2°C every 10 years.
04.
Climate change and global warming trends in Korea over the past 100 years
05.
Our country is becoming increasingly dark
06.
El Niño-Southern Oscillation (ENSO) and Global Mean Surface Temperature (GMST)
07.
Rossby waves and Omega blocks
08.
Global sea levels are rising by about 3.7mm each year.
09.
The oceans are also suffering a lot because of global warming.
10.
Global average surface seawater pH change, 1985–2022
11.
The average sea surface temperature in the waters surrounding our country is rising by 0.24°C every 10 years.
12.
The 10 biggest meteorological disasters in Asia and Europe over the past 50 years
13.
Comparison of new climate averages by metropolitan area with climate values from 30 years ago
14.
Rising surface ozone concentrations and climate change in the city (Seoul)
15.
Number of species on Earth and in our country
16.
Final Assessment Results of the 20 Aichi Biodiversity Targets
17. Consensus Views of the IPCC and IPBES (1-3)
18.
The worsening threat of biodiversity extinction due to climate change and the status of natural ecosystem protection areas
II.
Greenhouse Gas Emissions Status: International
19.
The 35 largest carbon dioxide emitters in 2022, according to data from the Global Carbon Project.
20.
Total greenhouse gas emissions and carbon dioxide from the top 20 countries in cumulative emissions
21.
Greenhouse gas emission pathways of the top 10 economies in 2021
22. Changes in value added output relative to electricity consumption in industrial sectors by OECD country
23. Comparison of per capita electricity consumption by OECD country
24.
Power generation ratio by energy source in OECD member countries China, India, and Brazil in 2023
25.
Greenhouse gas emissions and natural decomposition times during production of each type of plastic
26.
Different greenhouse gas emissions depending on the color (production method) of hydrogen
III.
Greenhouse Gas Emissions Status: Korea
27. Greenhouse gas emissions by mid-sector in Korea according to the IPCC 6th Assessment Report
28.
Every eight years, forests the size of Seoul disappear.
29.
What sector consumes the most energy in our country and what are its sources of energy?
30.
What is the most used energy source by sector in our country?
31.
Energy consumption per household by income level in 17 cities and provinces I
32.
Energy consumption per household by income level in 17 cities and provinces II
33.
Comparison of energy consumption per unit area of residential buildings by city, county, and district nationwide
34.
Where does fine dust in our country come from?
35.
Plastic Waste and COVID-19
IV.
Causes of climate change
36.
Greenhouse Gases and Climate Change: Which Comes First, the Chicken or the Egg?
37.
Energy accumulated on Earth due to greenhouse gases
38.
The Keeling Curve
39.
Global warming increases water vapor
40.
Human-caused global warming began 6,500 years ago.
41.
Changes in global atmospheric greenhouse gas concentrations through 2022
42.
Climate Change Science as Seen Through the Nobel Prize
V.
Outlook and Scenarios
43. Ten Conclusions from the UNFCCC Long-Term Universal Periodic Review of Global Goals
44. Five "Common Socio-Economic Pathways" Used by IPCC and IPBES Scientists in Their Scenarios
45.
Climate change in our country through achieving global climate goals
46.
South Korea's GDP projections based on climate change response
VI.
Climate Action and Its Impact
47.
What is 'Carbon Neutrality'? Understanding and Comparing It with Other Terms
48.
Even with the same goal of achieving carbon neutrality by 2050, the pace of action determines the amount of additional CO₂ emissions.
49.
Potential and cost ranges of sector-specific greenhouse gas reduction measures worldwide
50. Energy Transition Trends in OECD Member Countries Over the Past 30 Years
51.
Intermediate Goals for Achieving Carbon Neutrality in the Energy Sector by 2050
52.
Comparison of electricity production costs by country (region) under two climate action scenarios
53.
The views of many Europeans and Americans on nuclear power
54.
The sooner the better: Energy Transition to Reduce Greenhouse Gases: A Case Study in the Transportation Sector
55.
60 Ways Individuals Can Reduce Greenhouse Gas Emissions
56.
Have our country's climate change mitigation policies affected greenhouse gas emissions?
57.
Carbon Neutrality in Local Governments: Who Should Take More Responsibility?
58.
Ranking of local governments by per capita renewable energy production in 2022
59.
What if the revenue from renewable energy power sales were distributed to local residents?
60.
Results and Reflections from the Global Implementation Review (GST) of the Paris Agreement
61.
Protecting Biodiversity from Fossil Fuels and Resource Extraction: Have You Heard of the Deep-Sea 'Umbrella Octopus'?
62.
Summary of Michael Mann's book, The New Climate Wars
63.
Climate books that caught the attention of foreign media
64.
Climate Tipping Points vs. Social Action
Social Tipping Interventions)
Detailed image

Into the book
In our country, the rate of increase is faster than the global average surface temperature increase rate (0.14°C/10 years).
According to the worst-case scenario (SSP5-8.5), the number of annual heat wave days in Seoul, currently 15 days, will increase to 54.7 days in the 2050s.
--- 「03.
“Our country’s average surface temperature has risen by 0.2°C every 10 years.”
The Korea Meteorological Administration report warns that if sea levels continue to rise as they are now and storm surges from typhoons occur, Incheon Metropolitan City could be submerged by up to 26.6% (by 2030) to 33.6% (by 2100) of seawater at high tide.
--- 「08.
Global sea levels are rising by about 3.7mm per year.
Ozone (O₃) has a short lifespan, but its raw materials, air pollutants (nitrogen oxides, non-methane volatile organic compounds, carbon monoxide, etc.) and methane, are constantly emitted into our daily lives, constantly threatening our health.
The effect is greater in summer when the sunlight is stronger.
Unlike coronavirus or fine dust, gaseous ozone is difficult to block even with a KF94 (or N95) mask.
The damage caused by ozone could be reduced by simply stopping the emissions of its causative substances right now.
This will help alleviate global warming and also help your health.
--- 「14.
From “Rising surface ozone concentration and climate change in the city (Seoul)”
The implementation period (2011-2020) of the Aichi Biodiversity Targets (ABTs), which the world agreed to achieve together over a 10-year period under the United Nations (UN) Convention on Biological Diversity (CBD), has ended. The CBD Secretariat announced the final evaluation results of the ABTs, and not a single one of the 20 targets was achieved.
--- 「16.
From the “Final Evaluation Results of the 20 Aichi Biodiversity Targets”
Current production methods for plastics, which are primarily made from fossil fuels, emit more greenhouse gases than their own weight when first produced.
After use, it takes up to 5,000 years on land and up to 1,200 years in the ocean for plastic to be reduced by half (just!) through natural decomposition, depending on the type and form of plastic.
--- 「25.
From “Greenhouse gas emissions and natural decomposition time during production by type of plastic”
For every 1°C increase in temperature, the amount of water vapor in the low-altitude atmosphere increases by 2–3% (theoretically up to 7%/°C increase).
The main energy source for the creation and growth of tropical cyclones (typhoons, hurricanes, and cyclones) is the latent heat released as water vapor condenses over the ocean (heat of condensation).
In other words, the more water vapor there is above the sea, the stronger the typhoon.
--- 「39.
“Global warming increases water vapor”
Climate change-related terms, while seemingly clear in their meaning, actually hinder the understanding of climate change by those with limited expertise.
Among them, the most famous, yet still misunderstood term, “carbon neutrality”, what does it mean?
--- 「47.
What is 'Carbon Neutrality'? Understanding It Compared to Other Terms"
Based on the levelized cost of electricity (LCOE), the International Energy Agency projects that solar and wind power will be the cheapest sources of electricity in all countries by 2040.
In other words, the scope of change in energy transition is no exception in China or India.
In all scenarios, solar becomes the cheapest in all regions, followed by wind (onshore or offshore).
--- 「52.
From “Comparison of electricity production costs by country (region) under two climate action scenarios”
As of 2022, the national average per capita renewable energy production is approximately 11,545 MJ, which is less than 7% of consumption, and the national average per capita renewable energy generation is approximately 983 kWh, which is only about 9% of consumption.
All energy sources other than renewable energy are supplied by importing raw materials.
Expanding the supply of renewable energy is essential to ensure our country's energy security.
--- 「58.
From the “2022 Per Capita Renewable Energy Production Rankings of Basic Local Governments”
Sectors such as industrial processes (+12.4%), waste (+19.2%), buildings (+7.6%), and agriculture (+6.4%) will all have significantly increased greenhouse gas emissions in 2022 compared to 2019, moving in the opposite direction of the reduction target.
In particular, the fact that waste generation has increased by nearly a fifth makes us wonder if we are becoming accustomed to a throwaway lifestyle.
--- 「60.
From “Results and Reflections on the Global Implementation Review (GST) of the Paris Agreement”
From “Results and Reflections on the Global Implementation Review (GST) of the Paris Agreement”
Publisher's Review
In the age of climate crisis, we must prevent climate catastrophe.
The world is reeling from climate change.
In 2021, when the first edition was published, several extreme weather events occurred beyond imagination.
In June, a heatwave in northwestern North America killed between 800 and 1,400 people and over a billion marine creatures, while in July, unexpected heavy rain killed more than 140 people in Germany, Belgium and other countries, and in the same month, Zhengzhou City in Henan Province, China, saw over 200 millimeters of rain fall in one hour.
All three of these extreme weather events are mathematically predicted to occur once every 1,000 years, meaning they have a return period of 1,000 years. These high temperatures and guerrilla rains are representative signs of global warming.
Now, as the revised edition is published, a little over three years have passed, but the situation remains grim.
Global carbon emissions reached 40.9 billion tons in 2023, and if these emissions levels continue, the Paris Agreement's goal of limiting the increase in the global mean surface temperature (GMST) to 1.5°C above pre-industrial levels will be virtually impossible to achieve within four years.
We are now in an era of climate crisis, with the time available to respond to climate change being far too short compared to its severity. Unless we take proactive action, the remaining time will undoubtedly shorten further.
To take action, we must first understand the specific causes and current status of climate change.
Only then can we find answers to how and at what speed we should change our lives to prevent climate catastrophe.
What should we do to prevent the climate crisis?
With the global average surface temperature now 1.2°C higher than pre-industrial levels, not only environmentalists but also national leaders are now talking about carbon neutrality (net zero carbon dioxide emissions).
At the 26th Conference of the Parties to the United Nations Framework Convention on Climate Change (UNFCCC COP26) held in Glasgow, UK on November 13, 2021, countries, including Korea, submitted increased greenhouse gas reduction targets, but it is uncertain whether these will be achieved on time.
Far from reducing emissions, the world emitted 2.3% more greenhouse gases in 2022 than in 2019.
Several recent studies indicate that irreversible climate change could be triggered even at global warming levels of 1.5°C.
A review of the global climate change response by the end of 2023 shows that 20.3 billion tons of carbon dioxide equivalent (tCO₂-eq) of reductions will be needed by 2030 to achieve the Paris Agreement goals.
If we continue at this rate, we will fail to address climate change.
The United Nations Environment Programme calls for limiting greenhouse gas emissions per capita to 0.9 tonnes of carbon dioxide equivalent by 2050.
In order to avoid triggering a tipping point, South Korea, which had greenhouse gas emissions per capita of 14.2 tons of carbon dioxide equivalent in 2018, must literally adopt a lifestyle that reduces greenhouse gas emissions by 1/15th of current levels within a single generation.
To achieve carbon neutrality by 2050, fossil fuel power plants must be offline 30 years from now.
Since the more energy we use, the more greenhouse gases we emit, the alternatives to mitigating climate change are to reduce absolute energy use or use energy that does not emit greenhouse gases.
In particular, for sectors that emit large amounts of greenhouse gases, specific alternatives must be set as targets and implemented more actively.
It's important not to lose hope
We cannot live without hope.
Excessive talk of 'climate despair' is dangerous because it dampens the motivation to take action.
Difficult climate change terminology also confuses us.
Information about climate change should no longer be distant from our lives.
This book explains the concepts of related terms in an easy-to-understand way and details the goals and effects of each stage of climate action, suggesting that change is possible if we act.
If governments, the international community, and businesses hesitate to take climate action, we can only hope for citizens who consider the climate crisis their own and take action together.
The book explains climate change through "data," but as the author says in the preface, just as important as data is the attitude of empathizing with the plight of other living beings.
The numerical data showing that the ocean is warming more than the atmosphere, with the ocean storing “91% of the net energy accumulating” trapped on Earth due to greenhouse gases, fails to show the breathtakingly hot water temperatures reported by Jeju haenyeo (female divers) or the dire situation where marine life is no longer able to survive and even things to eat are disappearing.
Therefore, this book values the voices and actions of citizens who imagine and empathize.
Why is Earth becoming uninhabitable for life, including humans? What can we do to restore the Earth's environment and our healthy, safe lives? This is a question we must all constantly ask and answer.
The Climate Change Databook is a compilation of climate change-related data, including assessments of the latest scientific evidence on climate change, statistical data and reports from domestic and international governments, research institutes, and international organizations on ecosystems, energy, and the economy—all essential for understanding climate change.
These data, which clearly show the current state of the domestic and international climate crisis caused by global warming, raise the alarm that Earth's time is running out.
We also present positive data on climate action initiatives, such as carbon neutrality and renewable energy use, and urge citizens to take active civic action for a sustainable future for themselves and their descendants.
We hope that the Climate Change Databook will help readers and all citizens understand the current state of the climate crisis and take proactive action to prevent climate catastrophe.
This book is made with eco-friendly paper to support a sustainable Earth and publishing environment.
The main body paper is made of recycled paper ‘Green Light’, and the cover paper is made of ‘INSPER ECO’, which contains 30% recycled pulp and has received environmental label certification.
GOODS SPECIFICS
- Date of issue: August 29, 2024
- Page count, weight, size: 244 pages | 210*210*20mm
- ISBN13: 9791167071590
- ISBN10: 116707159X
You may also like
카테고리
korean


korean

![GQ KOREA Mark (Monthly): December [2025]](http://librairie.coreenne.fr/cdn/shop/files/8ef265dbbfbf186523ed75ba7319009d.jpg?v=1765340328&width=3840)


