

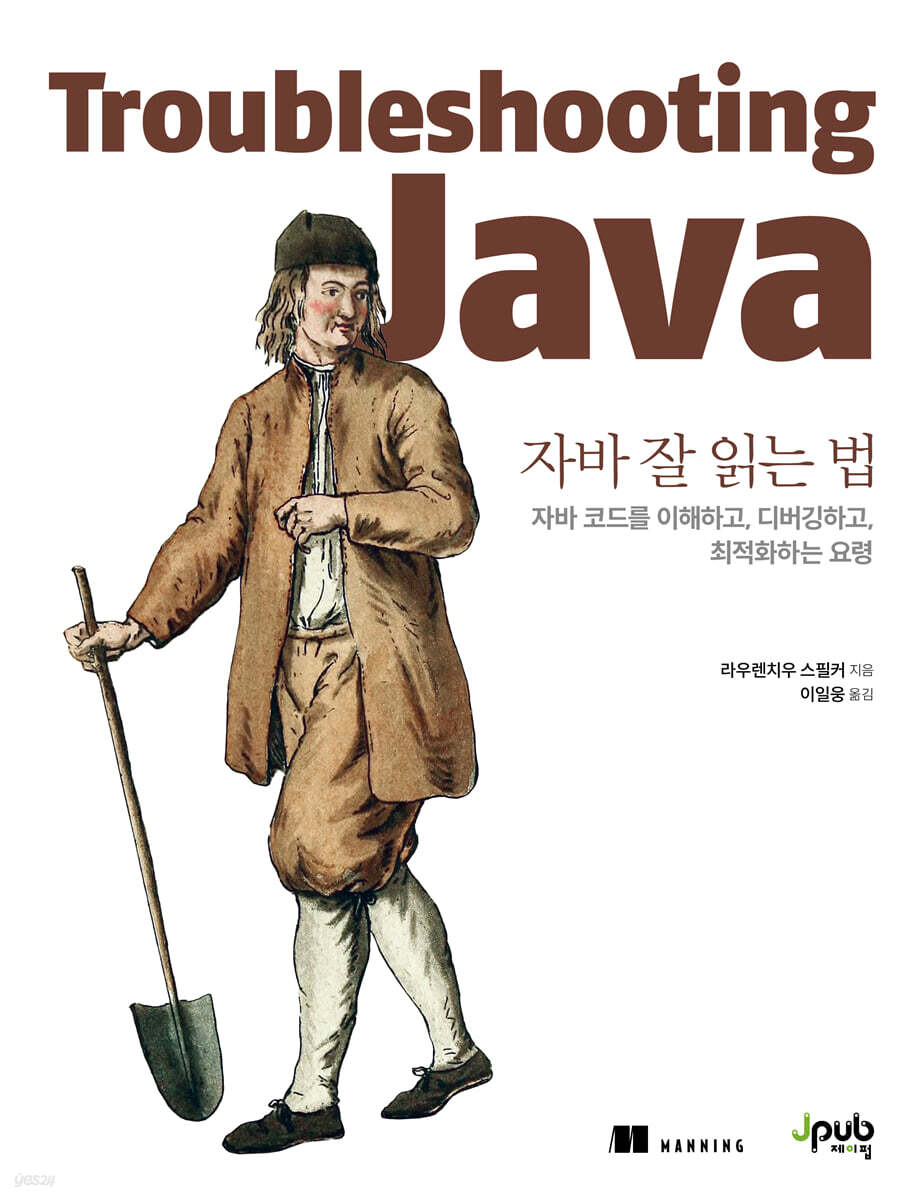
How to read Java well
 |
Description
Book Introduction
Profiling, debugging, and logging techniques to find Java bugs and performance issues.
In practice, developers spend most of their time reading and understanding existing code.
This book introduces practical techniques that will reduce the time it takes to understand unfamiliar Java code.
By profiling and debugging, and ultimately understanding how your JVM applications actually work, you can find the root causes of dependencies or crashes and interpret unexpected results.
From the basics of debugging to advanced methods for finding problems in microservice architectures, this book teaches you how to "read" Java code with informal illustrations and engaging real-world examples.
In practice, developers spend most of their time reading and understanding existing code.
This book introduces practical techniques that will reduce the time it takes to understand unfamiliar Java code.
By profiling and debugging, and ultimately understanding how your JVM applications actually work, you can find the root causes of dependencies or crashes and interpret unexpected results.
From the basics of debugging to advanced methods for finding problems in microservice architectures, this book teaches you how to "read" Java code with informal illustrations and engaging real-world examples.
- You can preview some of the book's contents.
Preview
index
Translator's Preface x
Beta Reader Review xi
Beginning xiv
Acknowledgments xvi
About this book xviii
About the cover xxi
PART I: Basic Troubleshooting Techniques
CHAPTER 1 Clarifying Ambiguous Parts of the App 3
1.1 How to understand the app more easily 4
1.2 Common Code Investigation Scenarios 8
__1.2.1 Identify the cause of unexpected output 9
__1.2.2 Acquire specific skills 14
__1.2.3 Find out why the speed is slowing down 15
__1.2.4 Understanding Why Apps Crash 16
1.3 What You Will Learn in This Book 19
Summary 20
CHAPTER 2 Understanding App Logic with Debugging Techniques 21
2.1 When Code Analysis Alone Is Insufficient 23
2.2 Examining Code Using a Debugger 26
__2.2.1 What is an execution stack trace and how should I use it? 31
__2.2.2 Navigating Code with the Debugger 36
2.3 If the debugger isn't enough, try 43
Summary 45
CHAPTER 3 Finding the Root Cause of Problems with Advanced Debugging Techniques 47
3.1 Minimizing investigation time with conditional breakpoints 48
3.2 How to use breakpoints without stopping execution 52
3.3 Dynamically Changing the Investigation Scenario 55
3.4 Rewind the investigation case 58
Summary 64
CHAPTER 4: Debugging Remote Apps 65
4.1 What is remote debugging? 66
4.2 Investigating in a Remote Environment 69
__4.2.1 Scenario 70
__4.2.2 Investigating Problems in a Remote Environment 71
Summary 81
CHAPTER 5 Monitoring App Behavior Using Logs 83
5.1 Investigating Using Logs 87
__5.1.1 Identifying Exceptions Recorded in Logs 88
__5.1.2 Identifying where a method was called with an exception stack trace 89
__5.1.3 Measuring Command Execution Time in a Multithreaded Architecture 91
__5.1.4 Investigating Command Execution Issues in Multithreaded Architectures 92
5.2 How to implement logging 94
__5.2.1 Saving Log Messages 94
__5.2.2 How to define logging levels and use the logging framework 95
__5.2.3 Problems and Precautions Caused by Logging 102
5.3 Logs and Remote Debugging 107
Summary 108
PART II Advanced Troubleshooting Techniques
CHAPTER 6 Identifying Resource Usage Problems with Profiling Techniques 111
6.1 When is a profiler useful? 112
__6.1.1 Identifying Abnormal Resource Usage 112
__6.1.2 Finding the code that is running 113
__6.1.3 Identifying the cause of slow app launch speed 114
6.2 How to Use the Profiler 114
__6.2.1 Installing and Configuring VisualVM 115
__6.2.2 Observing CPU and Memory Usage 117
__6.2.3 Identifying Memory Leaks 127
Summary 132
CHAPTER 7: Finding Hidden Issues with Profiling Techniques 133
7.1 Observing Code Executed with Sampling 134
7.2 Determining the number of times a method is executed using profiling 142
7.3 Using the Profiler to Determine Which SQL Queries Your App Actually Executes 144
__7.3.1 Identifying Non-Framework-Generated SQL Queries with the Profiler 144
__7.3.2 Identifying Framework-Generated SQL Queries with a Profiler 150
__7.3.3 Identifying SQL Queries Generated by Programs with a Profiler 153
Summary 157
CHAPTER 8 Applying Advanced Visualization Tools to Profiled Data 159
8.1 Detecting JDBC Connection Problems 160
8.2 Understanding the app's code design by looking at the call graph 173
8.3 Drawing Flame Graphs to Identify Performance Issues 175
8.4 Query Analysis in NoSQL DBs 179
Summary 180
CHAPTER 9 Investigating Locking Problems in Multithreaded Architectures 183
9.1 Thread Lock Monitoring 184
9.2 Thread Lock Analysis 189
9.3 Analyzing Waiting Threads 198
Summary 205
CHAPTER 10 Investigating Deadlock Problems with Thread Dumps 207
10.1 Collecting Thread Dumps 208
__10.1.1 Collecting Thread Dumps with Profiler 210
__10.1.2 Collecting thread dumps from the command line 212
10.2 How to Read a Thread Dump 215
__10.2.1 Plain Text Thread Dump 216
__10.2.2 Reading Thread Dumps Using Tools 222
Summary 225
CHAPTER 11 Finding Memory-Related Issues While Running an App 227
11.1 Diagnosing Memory Issues with Sampling and Profiling 228
11.2 Collecting Heap Dumps to Find Memory Leaks 235
__11.2.1 Collecting Heap Dumps 236
__11.2.2 How to read a heap dump 240
__11.2.3 Heap Dump Query in OQL Console 245
Summary 251
PART III TROUBLESHOOTING LARGE-SCALE SYSTEMS
CHAPTER 12 Investigating the Behavior of Apps Deployed on Large-Scale Systems 255
12.1 Investigating Inter-Service Communication Issues 256
__12.1.1 Observing HTTP Requests with HTTP Server Probe 257
__12.1.2 Observing HTTP requests sent by your app with the HTTP client probe 259
__12.1.3 Investigating Socket Low-Level Events 261
12.2 The Importance of Integrated Log Monitoring 263
12.3 How to Use Distribution Tools for Research 270
__12.3.1 Simulating Problems Difficult to Reproduce with Fault Injection 272
__12.3.2 Using Mirroring Techniques for Testing and Error Detection 273
Summary 274
APPENDIX A Tools Used in This Book 275
APPENDIX B Opening a Project 277
APPENDIX C Other References 279
APPENDIX D Understanding Java Threads 281
D.1 What is a Thread? 282
D.2 Thread Life Cycle 284
D.3 Thread Synchronization 286
__D.3.1 Synchronization Block 286
__D.3.2 Using wait(), notify(), and notifyAll() 289
__D.3.3 Thread Join 290
__D.3.4 Blocking a thread for a fixed period of time 291
__D.3.5 Synchronizing Threads and Blocking Objects 292
D.4 Common Problems with Multithreaded Architectures 293
__D.4.1 Race Conditions 293
__D.4.2 Deadlock 294
__D.4.3 Ribrak 295
__D.4.4 Kia 296
D.5 Additional Material 297
APPENDIX E Java Memory Management Framework 299
E.1 How the JVM Organizes Your App's Memory 300
E.2 Stack 302 used by threads to store local data
E.3 Heap 308 used by the app to store object instances
E.4 Metaspace memory locations for storing data types 311
Search 313
Beta Reader Review xi
Beginning xiv
Acknowledgments xvi
About this book xviii
About the cover xxi
PART I: Basic Troubleshooting Techniques
CHAPTER 1 Clarifying Ambiguous Parts of the App 3
1.1 How to understand the app more easily 4
1.2 Common Code Investigation Scenarios 8
__1.2.1 Identify the cause of unexpected output 9
__1.2.2 Acquire specific skills 14
__1.2.3 Find out why the speed is slowing down 15
__1.2.4 Understanding Why Apps Crash 16
1.3 What You Will Learn in This Book 19
Summary 20
CHAPTER 2 Understanding App Logic with Debugging Techniques 21
2.1 When Code Analysis Alone Is Insufficient 23
2.2 Examining Code Using a Debugger 26
__2.2.1 What is an execution stack trace and how should I use it? 31
__2.2.2 Navigating Code with the Debugger 36
2.3 If the debugger isn't enough, try 43
Summary 45
CHAPTER 3 Finding the Root Cause of Problems with Advanced Debugging Techniques 47
3.1 Minimizing investigation time with conditional breakpoints 48
3.2 How to use breakpoints without stopping execution 52
3.3 Dynamically Changing the Investigation Scenario 55
3.4 Rewind the investigation case 58
Summary 64
CHAPTER 4: Debugging Remote Apps 65
4.1 What is remote debugging? 66
4.2 Investigating in a Remote Environment 69
__4.2.1 Scenario 70
__4.2.2 Investigating Problems in a Remote Environment 71
Summary 81
CHAPTER 5 Monitoring App Behavior Using Logs 83
5.1 Investigating Using Logs 87
__5.1.1 Identifying Exceptions Recorded in Logs 88
__5.1.2 Identifying where a method was called with an exception stack trace 89
__5.1.3 Measuring Command Execution Time in a Multithreaded Architecture 91
__5.1.4 Investigating Command Execution Issues in Multithreaded Architectures 92
5.2 How to implement logging 94
__5.2.1 Saving Log Messages 94
__5.2.2 How to define logging levels and use the logging framework 95
__5.2.3 Problems and Precautions Caused by Logging 102
5.3 Logs and Remote Debugging 107
Summary 108
PART II Advanced Troubleshooting Techniques
CHAPTER 6 Identifying Resource Usage Problems with Profiling Techniques 111
6.1 When is a profiler useful? 112
__6.1.1 Identifying Abnormal Resource Usage 112
__6.1.2 Finding the code that is running 113
__6.1.3 Identifying the cause of slow app launch speed 114
6.2 How to Use the Profiler 114
__6.2.1 Installing and Configuring VisualVM 115
__6.2.2 Observing CPU and Memory Usage 117
__6.2.3 Identifying Memory Leaks 127
Summary 132
CHAPTER 7: Finding Hidden Issues with Profiling Techniques 133
7.1 Observing Code Executed with Sampling 134
7.2 Determining the number of times a method is executed using profiling 142
7.3 Using the Profiler to Determine Which SQL Queries Your App Actually Executes 144
__7.3.1 Identifying Non-Framework-Generated SQL Queries with the Profiler 144
__7.3.2 Identifying Framework-Generated SQL Queries with a Profiler 150
__7.3.3 Identifying SQL Queries Generated by Programs with a Profiler 153
Summary 157
CHAPTER 8 Applying Advanced Visualization Tools to Profiled Data 159
8.1 Detecting JDBC Connection Problems 160
8.2 Understanding the app's code design by looking at the call graph 173
8.3 Drawing Flame Graphs to Identify Performance Issues 175
8.4 Query Analysis in NoSQL DBs 179
Summary 180
CHAPTER 9 Investigating Locking Problems in Multithreaded Architectures 183
9.1 Thread Lock Monitoring 184
9.2 Thread Lock Analysis 189
9.3 Analyzing Waiting Threads 198
Summary 205
CHAPTER 10 Investigating Deadlock Problems with Thread Dumps 207
10.1 Collecting Thread Dumps 208
__10.1.1 Collecting Thread Dumps with Profiler 210
__10.1.2 Collecting thread dumps from the command line 212
10.2 How to Read a Thread Dump 215
__10.2.1 Plain Text Thread Dump 216
__10.2.2 Reading Thread Dumps Using Tools 222
Summary 225
CHAPTER 11 Finding Memory-Related Issues While Running an App 227
11.1 Diagnosing Memory Issues with Sampling and Profiling 228
11.2 Collecting Heap Dumps to Find Memory Leaks 235
__11.2.1 Collecting Heap Dumps 236
__11.2.2 How to read a heap dump 240
__11.2.3 Heap Dump Query in OQL Console 245
Summary 251
PART III TROUBLESHOOTING LARGE-SCALE SYSTEMS
CHAPTER 12 Investigating the Behavior of Apps Deployed on Large-Scale Systems 255
12.1 Investigating Inter-Service Communication Issues 256
__12.1.1 Observing HTTP Requests with HTTP Server Probe 257
__12.1.2 Observing HTTP requests sent by your app with the HTTP client probe 259
__12.1.3 Investigating Socket Low-Level Events 261
12.2 The Importance of Integrated Log Monitoring 263
12.3 How to Use Distribution Tools for Research 270
__12.3.1 Simulating Problems Difficult to Reproduce with Fault Injection 272
__12.3.2 Using Mirroring Techniques for Testing and Error Detection 273
Summary 274
APPENDIX A Tools Used in This Book 275
APPENDIX B Opening a Project 277
APPENDIX C Other References 279
APPENDIX D Understanding Java Threads 281
D.1 What is a Thread? 282
D.2 Thread Life Cycle 284
D.3 Thread Synchronization 286
__D.3.1 Synchronization Block 286
__D.3.2 Using wait(), notify(), and notifyAll() 289
__D.3.3 Thread Join 290
__D.3.4 Blocking a thread for a fixed period of time 291
__D.3.5 Synchronizing Threads and Blocking Objects 292
D.4 Common Problems with Multithreaded Architectures 293
__D.4.1 Race Conditions 293
__D.4.2 Deadlock 294
__D.4.3 Ribrak 295
__D.4.4 Kia 296
D.5 Additional Material 297
APPENDIX E Java Memory Management Framework 299
E.1 How the JVM Organizes Your App's Memory 300
E.2 Stack 302 used by threads to store local data
E.3 Heap 308 used by the app to store object instances
E.4 Metaspace memory locations for storing data types 311
Search 313
Detailed image

Into the book
A debugger is a software program that helps developers read and understand source code more easily by executing the code step by step while briefly pausing execution at desired commands.
Although debuggers are a common means of investigating software behavior (and often the first thing developers learn), they are not the only debugging technique, nor are they useful in all scenarios (basic debugger usage and advanced techniques are covered in Chapters 2 and 3).
The various research techniques you will learn throughout this book are illustrated in Figure 1.3.
--- P.6
As with any investigative technique, there are times when logs are appropriate to use and times when they are not.
In this section, we'll explore several scenarios where using logs can make it easier to understand your app's behavior.
First, we'll discuss some key points about log messages, and then we'll explore how these characteristics can help developers investigate issues in their apps.
--- P.87
The simplest thing you can do with a profiler is to observe how your app uses system resources.
Just by looking at it this way, you can discover problems such as memory leaks or zombie threads in your app.
/ By looking into a running app with a profiler, you can easily discover abnormal app behavior.
For example, zombie threads that remain running and occupy the app's resources even after the app has finished running are immediately exposed in VisualVM.
Now, let's look at how VisualVM can be used to detect and observe signs of an abnormal resource consumption in an app.
--- P.117
Profile the JDBC driver to intercept queries the app sends to the DB.
As a result of the verification (Figure 7.14), the product table is doing a self-join with itself.
This is a serious problem! This example might seem trivial since the table only has 10 records, but in a real-world app, the table would likely have a huge number of records. Cross-joining like this would inevitably result in significant latency and ultimately incorrect output (duplicate rows).
By intercepting the query with VisualVM and looking into it, you can immediately see where the problem is.
--- P.154
Select the Sampler tab in VisualVM and then click the Memory button to start a memory usage sampling session.
After calling the endpoint and waiting for it to complete, you will see the objects allocated by your app appear on the VisualVM screen after a short while.
(…) I understand that a large number of instances can fill up memory, but is it possible that a small number of large instances, like the latter, can take up most of the memory? Think of an app that processes large video files.
Load 2-3 files at a time, but video files are so large that they can fill up memory.
In these cases, it's worth exploring whether the app can be optimized by not loading the entire file into memory at once, but rather loading only portions of it at a time.
--- P.231
Since this app is developed based on Spring Boot, the DSN value is specified in the sentry.dsn attribute in the application.properties file as shown in the following code snippet.
This is optional in Sentry, but it is recommended to specify the environment in which your app runs if possible.
This is because later on, you can filter the events to extract only the ones you are interested in.
Although debuggers are a common means of investigating software behavior (and often the first thing developers learn), they are not the only debugging technique, nor are they useful in all scenarios (basic debugger usage and advanced techniques are covered in Chapters 2 and 3).
The various research techniques you will learn throughout this book are illustrated in Figure 1.3.
--- P.6
As with any investigative technique, there are times when logs are appropriate to use and times when they are not.
In this section, we'll explore several scenarios where using logs can make it easier to understand your app's behavior.
First, we'll discuss some key points about log messages, and then we'll explore how these characteristics can help developers investigate issues in their apps.
--- P.87
The simplest thing you can do with a profiler is to observe how your app uses system resources.
Just by looking at it this way, you can discover problems such as memory leaks or zombie threads in your app.
/ By looking into a running app with a profiler, you can easily discover abnormal app behavior.
For example, zombie threads that remain running and occupy the app's resources even after the app has finished running are immediately exposed in VisualVM.
Now, let's look at how VisualVM can be used to detect and observe signs of an abnormal resource consumption in an app.
--- P.117
Profile the JDBC driver to intercept queries the app sends to the DB.
As a result of the verification (Figure 7.14), the product table is doing a self-join with itself.
This is a serious problem! This example might seem trivial since the table only has 10 records, but in a real-world app, the table would likely have a huge number of records. Cross-joining like this would inevitably result in significant latency and ultimately incorrect output (duplicate rows).
By intercepting the query with VisualVM and looking into it, you can immediately see where the problem is.
--- P.154
Select the Sampler tab in VisualVM and then click the Memory button to start a memory usage sampling session.
After calling the endpoint and waiting for it to complete, you will see the objects allocated by your app appear on the VisualVM screen after a short while.
(…) I understand that a large number of instances can fill up memory, but is it possible that a small number of large instances, like the latter, can take up most of the memory? Think of an app that processes large video files.
Load 2-3 files at a time, but video files are so large that they can fill up memory.
In these cases, it's worth exploring whether the app can be optimized by not loading the entire file into memory at once, but rather loading only portions of it at a time.
--- P.231
Since this app is developed based on Spring Boot, the DSN value is specified in the sentry.dsn attribute in the application.properties file as shown in the following code snippet.
This is optional in Sentry, but it is recommended to specify the environment in which your app runs if possible.
This is because later on, you can filter the events to extract only the ones you are interested in.
--- P.267
Publisher's Review
Tips for understanding, debugging, and optimizing JVM code to improve code readability.
As you progress in your career, you'll find yourself spending far more time reading code than writing it.
This book covers code investigation techniques to use that long time efficiently.
A major advantage is that it explains troubleshooting in a developer-friendly, scenario-oriented manner, from the basics of debugging and logging to advanced profiling techniques and how JVM applications work.
Part 1 covers the basics of investigative techniques for understanding a codebase.
Chapters 2-4 focus on debugging, from simple breakpoints to remote debugging, while Chapter 5 looks at how to use logs to investigate essential details related to code implementation.
Part 2 demonstrates how useful profiling can be in today's framework-heavy development environment.
Chapter 6 covers how to analyze CPU and memory usage using profiling tools such as VisualVM and JProfiler, and Chapter 7 covers how to investigate latency issues.
Chapters 8 and 9 delve into multithreaded architecture, Chapter 10 looks at thread dumps, and Chapter 11 looks at how to diagnose memory problems by generating heap dumps.
Part 3, Chapter 12, explains how to investigate problems in large enterprise systems consisting of multiple apps, rather than just a single app.
We'll look at how each app "talks" to each other, the impact of the environment in which the app is deployed, and implementation considerations.
Finally, the appendix provides a detailed explanation of Java's thread and memory management system, which will be of practical help to Java developers.
Understanding how JVM applications actually work can help you pinpoint the root cause of problems.
This is a rare book that comprehensively covers not only debugging and logging, but also advanced techniques for finding problems in microservice architectures.
Key Contents
ㆍUnderstand what the code you see for the first time does
ㆍExposing code logic problems
ㆍFind memory leaks by evaluating heap dumps
ㆍMonitor CPU usage to optimize execution.
Finding and resolving deadlocks using thread dumps
Understanding Service-Oriented/Microservice Systems
ㆍUse logging properly to deeply understand Java app execution.
ㆍUsing the Java Debugger Efficiently
As you progress in your career, you'll find yourself spending far more time reading code than writing it.
This book covers code investigation techniques to use that long time efficiently.
A major advantage is that it explains troubleshooting in a developer-friendly, scenario-oriented manner, from the basics of debugging and logging to advanced profiling techniques and how JVM applications work.
Part 1 covers the basics of investigative techniques for understanding a codebase.
Chapters 2-4 focus on debugging, from simple breakpoints to remote debugging, while Chapter 5 looks at how to use logs to investigate essential details related to code implementation.
Part 2 demonstrates how useful profiling can be in today's framework-heavy development environment.
Chapter 6 covers how to analyze CPU and memory usage using profiling tools such as VisualVM and JProfiler, and Chapter 7 covers how to investigate latency issues.
Chapters 8 and 9 delve into multithreaded architecture, Chapter 10 looks at thread dumps, and Chapter 11 looks at how to diagnose memory problems by generating heap dumps.
Part 3, Chapter 12, explains how to investigate problems in large enterprise systems consisting of multiple apps, rather than just a single app.
We'll look at how each app "talks" to each other, the impact of the environment in which the app is deployed, and implementation considerations.
Finally, the appendix provides a detailed explanation of Java's thread and memory management system, which will be of practical help to Java developers.
Understanding how JVM applications actually work can help you pinpoint the root cause of problems.
This is a rare book that comprehensively covers not only debugging and logging, but also advanced techniques for finding problems in microservice architectures.
Key Contents
ㆍUnderstand what the code you see for the first time does
ㆍExposing code logic problems
ㆍFind memory leaks by evaluating heap dumps
ㆍMonitor CPU usage to optimize execution.
Finding and resolving deadlocks using thread dumps
Understanding Service-Oriented/Microservice Systems
ㆍUse logging properly to deeply understand Java app execution.
ㆍUsing the Java Debugger Efficiently
GOODS SPECIFICS
- Date of issue: May 9, 2024
- Page count, weight, size: 340 pages | 188*245*17mm
- ISBN13: 9791193926208
- ISBN10: 1193926203
You may also like
카테고리
korean


korean

![GQ KOREA Mark (Monthly): December [2025]](http://librairie.coreenne.fr/cdn/shop/files/8ef265dbbfbf186523ed75ba7319009d.jpg?v=1765340328&width=3840)


