

How to create and interpret SPSS results tables
 |
Description
Book Introduction
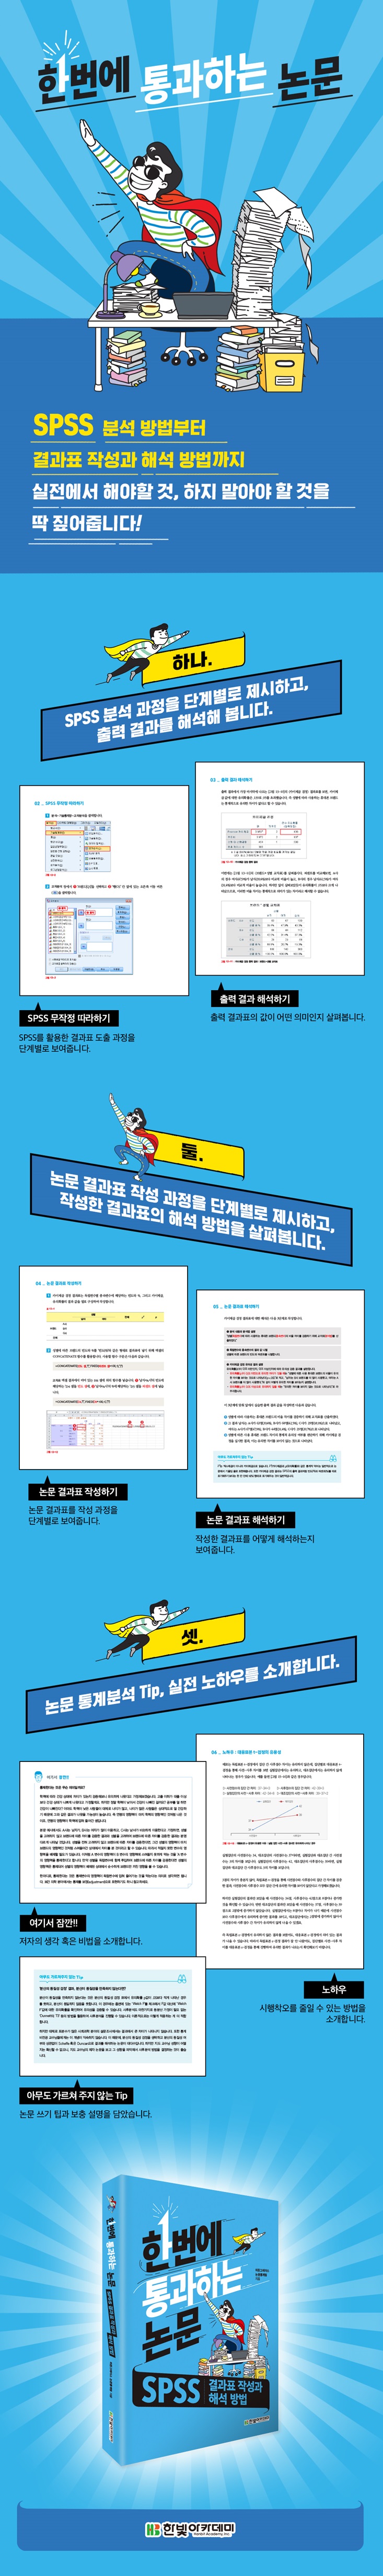
From SPSS analysis methods to creating and interpreting results tables
We'll give you a clear idea of what beginners should and shouldn't do when writing a thesis.
Hidden Grace Co., Ltd. has been providing easy-to-understand lectures and analysis of papers for researchers since 2013, aiming to be a guide that provides quick and accurate guidance to beginners in paper writing.
This book is compiled based on the results of open lectures and analyses.
- You can preview some of the book's contents.
Preview
index
PART 01 SPSS Paper Statistical Analysis: Basics
SECTION 01 SPSS, When to Use It?
01 SPSS, who would benefit from it?
02 Overall flow of the paper using SPSS
SECTION 02 Variable Setting
01 View variables
02 Name, Label (Description)
03 Type, width, decimal places
04 value
05 Missing values
Column 06
07 Custom
08 Measure
SECTION 03 Data Coding
01 View data
02 Data Coding Using Excel
SECTION 04 Main Menu and Top Menu
01 Main Menu
02 Basic Menu Know-How
03 Main Top Menu
SECTION 05 Merging Files
01 What is file merging?
02 How to merge files
SECTION 06 Case Selection
01 What is case selection?
02 How to Select a Case
SECTION 07 File Splitting
01 What is file splitting?
02 File Splitting Method
SECTION 08 DATA HANDLING
01 What is data handling?
02 Change the coding to the same variable (different variable)
03 How to change the coding to the same variable (different variable)
04 Variable calculation
05 Variable calculation method: sum, average
06 Variable calculation method: Checking cases with at least one missing value
07 Variable calculation method: log, root
SECTION 09 Frequency Analysis
01 What is frequency analysis?
02 Just follow SPSS
03 Interpreting the output results
04 Creating a thesis results table
SECTION 10 Descriptive Statistics Analysis
01 What is descriptive statistical analysis?
02 Just follow SPSS
03 Interpreting the output results
04 Creating a thesis results table
PART 02 SPSS Statistical Analysis of Papers: Practical Edition
SECTION 11 Things to know before conducting statistical analysis
01 Classification of data
02 Types of variables
03 Confidence level, significance level, significance probability
SECTION 12 Validity Analysis (Factor Analysis) / Reliability Analysis: Verifying the Suitability of Survey Items
01 What is validity analysis (factor analysis)?
02 SPSS: Just Follow: Validity Analysis (Factor Analysis)
03 Interpreting the Output Results: Validity Analysis (Factor Analysis)
04 What is reliability analysis?
05 SPSS: Reliability Analysis
06 Interpreting Output Results: Reliability Analysis
07 Writing a Thesis Results Table: Validity Analysis (Factor Analysis)
08 Interpreting the Thesis Results Table: Validity Analysis (Factor Analysis)
09 Interpreting the Paper Results Table: Reliability Analysis
10 Tips: When Factors Don't Bind Well
SECTION 13 Chi-Square Test (Cross-Tabulation): Analyzing Differences Between Categorical Data
01 Basic Concepts and Research Hypotheses
02 Just follow SPSS
03 Interpreting the output results
04 Creating a thesis results table
05 Interpreting the paper results table
06 Know-how: When the chi-square test results are not good
SECTION 14 Independent Samples t-Test: Comparing Means of Continuous Data Between Two Categorical Groups
01 Review: Calculating Means, Descriptive Statistics
02 Basic Concepts and Research Hypotheses
03 Just follow SPSS
04 Interpreting the output results
05 Creating a thesis results table
06 Interpreting the paper results table
07 Know-How: The Importance of Pre-Quality Verification
SECTION 15 Paired Samples t-Test: Testing the Mean Difference of Two Continuous Variables
01 Basic Concepts and Research Hypotheses
02 Just follow SPSS
03 Interpreting the output results
04 Creating a thesis results table
05 Interpreting the paper results table
06 Know-how: The Usefulness of the Paired Samples t-Test
SECTION 16 One-Way ANOVA: Comparing Means Across Three or More Groups
01 Basic Concepts and Research Hypotheses
02 Just follow SPSS
03 Interpreting the output results
04 Creating a thesis results table
05 Interpreting the paper results table
06 Know-how: When post-analysis is insignificant
SECTION 17 Two-Way ANOVA: Testing the Difference in the Dependent Variable According to Two Independent Variables
01 Basic Concepts and Research Hypotheses
02 Just follow SPSS
03 Interpreting the output results
04 Creating a thesis results table
05 Interpreting the paper results table
06 Know-how: Misunderstanding the Relationship Between Graph Slope and Interaction Effects
SECTION 18 Repeated Measures ANOVA: Testing the Mean Difference of the Dependent Variable According to Time Changes for Each Independent Variable
01 Basic Concepts and Research Hypotheses
02 Just follow SPSS
03 Interpreting the output results
04 Creating a thesis results table
05 Interpreting the paper results table
SECTION 19 Correlation Analysis: Identifying One-to-One Correlations Between Continuous Variables
01 Basic Concepts and Research Hypotheses
02 Just follow SPSS
03 Interpreting the output results
04 Creating a thesis results table
05 Interpreting the paper results table
SECTION 20 Simple Regression Analysis: Testing the Influence of Continuous Independent Variables on Continuous Dependent Variables
01 Basic Concepts and Research Hypotheses
02 Just follow SPSS
03 Interpreting the output results
04 Creating a thesis results table
05 Interpreting the paper results table
SECTION 21 Multiple Regression Analysis: Examining the Influence of Multiple Continuous Independent Variables on a Continuous Dependent Variable
01 Basic Concepts and Research Hypotheses
02 Just follow SPSS
03 Interpreting the output results
04 Creating a thesis results table
05 Interpreting the paper results table
06 Know-how: The Difference Between Correlation Analysis and Multiple Regression Analysis
SECTION 22 Dummy Transformation: Used to Control Categorical Variables in Regression Analysis
01 Basic Concepts and Research Hypotheses
02 Just follow SPSS
03 Interpreting the output results
04 Creating a thesis results table
05 Interpreting the paper results table
Know-how 06: How to Increase the Explanatory Power of Regression Models
SECTION 23 Hierarchical Regression Analysis: Regression analysis that proceeds step by step by adding variables.
01 Basic Concepts and Research Hypotheses
02 Just follow SPSS
03 Interpreting the output results
04 Creating a thesis results table
05 Interpreting the paper results table
SECTION 24 Logistic Regression Analysis: Testing the Influence of Continuous Independent Variables on Categorical Dependent Variables
01 Basic Concepts and Research Hypotheses
02 Just follow SPSS
03 Interpreting the output results
04 Creating a thesis results table
05 Interpreting the paper results table
Detailed image
Publisher's Review
PART 01 _ SPSS Paper Statistical Analysis: Basics
Part 01 covers the basics of using SPSS before conducting statistical analysis. Section 01 provides a general overview of how to use SPSS by examining the overall flow of a paper using SPSS. Sections 02-04 cover variable setting methods, data coding methods, and how to use the basic menu and main top menu. Sections 05-08 examine data handling essential for analysis. Sections 09-10 cover the most fundamental analysis methods, such as frequency analysis and descriptive statistics analysis, as well as how to write a paper based on the analysis.
PART 02 _ SPSS Paper Statistical Analysis: Practical Edition
In PART 02, we will learn in detail about the analysis method according to the researcher's hypothesis.
We will focus on the most commonly used analysis methods in theses.
In particular, we will examine how the methods of comparing groups and verifying relationships between variables are divided, as discussed in 『Passing Papers in One Go: Paper Search and Writing Strategies』 (Hanbit Academy, 2017).
We will also cover interpretation of output results and preparation of paper results tables, which are not mentioned in other paper-related books.
GOODS SPECIFICS
- Date of publication: March 28, 2018
- Page count, weight, size: 420 pages | 846g | 188*257*30mm
- ISBN13: 9791156643876
- ISBN10: 1156643872
You may also like
카테고리
korean


korean

![GQ KOREA Mark (Monthly): December [2025]](http://librairie.coreenne.fr/cdn/shop/files/8ef265dbbfbf186523ed75ba7319009d.jpg?v=1765340328&width=3840)


