

Candlestick Chart User Manual
 |
Description
Book Introduction
For stock beginners, the basics of trading,
For experts, the candlestick chart bible that explains the principles of the market!
How to Read the Stock Market Psychology to Win Both Short-Term and Long-Term
"Candlestick Chart User Manual" is the oldest and best-selling candlestick chart analysis textbook in Japan, the mecca of candlestick charts, which originated from Honma.
In the stock market, success is determined by the timing of trading.
So when should you sell and when should you buy? What tools do experts use to stay a step ahead of others? The answer lies in candlestick charts.
Ultimately, successful investments are determined by the timing of the trade.
Candlestick chart analysis, the easiest and most convenient market analysis method and one that has been used for a long time, is easy for anyone to learn.
"Candlestick Chart User's Manual," which has been a bestseller in Japan for a long time and has been exported to China and Taiwan, helps you predict whether the market will rise or fall by checking the candlestick charts that appear whenever the market goes through a cycle of growth, maturity, decline, and stagnation.
- You can preview some of the book's contents.
Preview
index
How to Read Candlestick Charts to Win in the Prologue Market
Part 1: Understanding Investor Psychology Reveals Cycles
01 Finding the truth of the times in the wisdom of our ancestors
Investor sentiment drives price movements | Use candlestick charts to understand investor sentiment first.
02 Investors are usually slow to react.
Know when to move | Market sentiment sometimes deviates significantly from people's perceptions.
03 How to avoid falling into the trap of prejudice
The Strange Psychology of Investors Who See Only What They Want to See | Price Rise and Buy Balance Are Directly Proportional
04 Beware of the Bandwagon Effect
If you buy, the price will go up. Because it's going up, you buy. Investors who buy at the peak are bound to be slow to react to a bear market.
05 To overcome the fear of being bitten by a high point by holding on to a topknot
Let's read the market rise and fall model | Graphing the change in unit daily returns | The decline in unit daily returns has already begun.
06 A decline in asset value is a trigger for selling.
Let's draw a moving average. If the actual price falls below the moving average, the value declines rapidly. If we analyze investor behavior from a psychological perspective, we'll always be bullish.
Part 2: You only need to know one candlestick chart.
01 Candlestick charts are the voice of God.
What is this chart? | Am I really analyzing it correctly? | How to read the key points even in confusing situations | The 'Voice of God' warns of clichés | Stock investment styles change as the uptrend ends
02 Investment Information Provided by the Flames of Candlestick Charts
The life cycle of a candle and the flow of the market move together.
03 What's in a 'Candle'?
Candlestick charts provide four key pieces of information at a glance | Understanding candlestick charts alone will change your perspective on the market | Reading market psychology with one, two, and three candlestick charts
04 Market trends shown by candlestick patterns
Long bullish candlestick | Long bearish candlestick | Bullish candlestick | Bearish candlestick | Crosshairs | Pay attention to investor sentiment shifts | Composite lines reveal more accurate information
Part 3: Candlestick Chart Signals for Successful Investments
01 The most important price is the 'closing price'
Candlesticks dominate the market | The "closing price" is the price most market participants consider appropriate | The length of the tails determines when to buy or sell.
02 Trading is all about timing.
If you're impatient, you lose. Those who know the resistance lines dominate the market.
03 Pay attention to the candle position
Just because a long bullish candle appears doesn't mean it's always time to buy. Even the same long bullish candle can have completely different meanings depending on its location.
Part 4: Reading Composite Lines on Candlestick Charts
01 Candles indicating a bottom
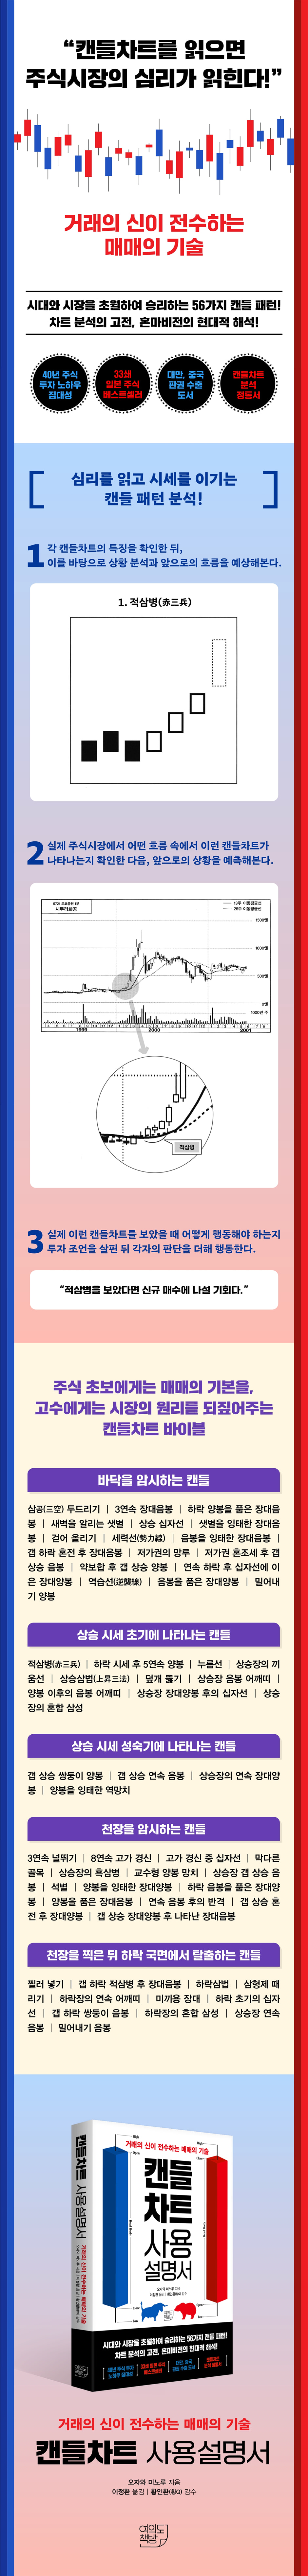
1.
Knocking on the three emptinesses | 2.
3 consecutive long candlesticks | 3.
Long black candle with a bearish bullish candle | 4.
The morning star that announces the dawn | 5.
Rising Crosshair | 6.
A long candle that conceived a morning star | 7.
Lift up | 8.
Line of force | 9.
A long candle that gives birth to a bearish candle | 10.
Gap downtrend followed by a long bearish candlestick | 11.
Low-cost watchtower | 12.
Gap rising candle after low-price mixed tax | 13.
Gap rising candle after weak consolidation | 14.
Long bullish candlestick following a crosshair after a series of declines | 15.
Counterattack Line | 16.
Long bullish candlestick with a negative candlestick | 17.
Push beekeeping
02 Candlesticks that appear in the early stages of an upward trend
1.
Red Three Soldiers | 2.
Five consecutive bullish candles after a bearish trend | 3.
Press line | 4.
Bullish Market Insertion Line | 5.
Ascension Sambeop (上昇三法) | 6.
Breaking through the cover | 7.
Rising candlestick shoulder strap | 8.
Yin candlestick shoulder straps after a bullish candlestick | 9.
Crosshairs after a long bullish candlestick in a bullish market | 10.
Mixed Samsung in a rising market
03 Candlesticks appearing in the rising market maturity phase
1.
Gap Rising Twin Candlesticks | 2.
Gap Rising Consecutive Negative Candlesticks | 3.
Consecutive long bullish candlesticks in a bull market | 4.
The inverted hammer that gave birth to beekeeping
04 Candles hinting at the ceiling
1.
3 consecutive jumps | 2.
8 consecutive highs | 3.
Crosshairs during high price renewal | 4.
Dead End | 5.
The Black Three Diseases of a Rising Market | 6.
Hanging Beekeeping Hammer | 7.
Bullish Gap Rising Candlestick | 8.
Farewell | 9.
Long-term beekeeping, the birthplace of beekeeping | 10.
Long bullish candlestick with a bearish candlestick | 11.
Long yin candle with a bullish sign | 12.
Counterattack after consecutive negative candlesticks | 13.
Gap Rising After a Long Bullish Candlestick | 14.
A long negative candlestick appears after a long positive candlestick with a gap upward.
05 Candlestick breaking out of a downward trend after hitting the ceiling
1.
Stab in | 2.
Gap down, three red candles followed by a long red candle | 3.
The Three Laws of Descending | 4.
Beating the Three Brothers | 5.
Consecutive Shoulder Straps in a Bear Market | 6.
Bait Rod | 7.
Crosshairs in the early stages of a decline | 8.
Gap Down Twin Candlesticks | 9.
Mixed Samsung in a Bear Market | 10.
Consecutive negative candlesticks in a rising market | 11.
Pushing candlestick
Epilogue: Candlestick charts that provide answers in moments of worry.
Why You Should Read Candle Psychology: The Editor's Note
Part 1: Understanding Investor Psychology Reveals Cycles
01 Finding the truth of the times in the wisdom of our ancestors
Investor sentiment drives price movements | Use candlestick charts to understand investor sentiment first.
02 Investors are usually slow to react.
Know when to move | Market sentiment sometimes deviates significantly from people's perceptions.
03 How to avoid falling into the trap of prejudice
The Strange Psychology of Investors Who See Only What They Want to See | Price Rise and Buy Balance Are Directly Proportional
04 Beware of the Bandwagon Effect
If you buy, the price will go up. Because it's going up, you buy. Investors who buy at the peak are bound to be slow to react to a bear market.
05 To overcome the fear of being bitten by a high point by holding on to a topknot
Let's read the market rise and fall model | Graphing the change in unit daily returns | The decline in unit daily returns has already begun.
06 A decline in asset value is a trigger for selling.
Let's draw a moving average. If the actual price falls below the moving average, the value declines rapidly. If we analyze investor behavior from a psychological perspective, we'll always be bullish.
Part 2: You only need to know one candlestick chart.
01 Candlestick charts are the voice of God.
What is this chart? | Am I really analyzing it correctly? | How to read the key points even in confusing situations | The 'Voice of God' warns of clichés | Stock investment styles change as the uptrend ends
02 Investment Information Provided by the Flames of Candlestick Charts
The life cycle of a candle and the flow of the market move together.
03 What's in a 'Candle'?
Candlestick charts provide four key pieces of information at a glance | Understanding candlestick charts alone will change your perspective on the market | Reading market psychology with one, two, and three candlestick charts
04 Market trends shown by candlestick patterns
Long bullish candlestick | Long bearish candlestick | Bullish candlestick | Bearish candlestick | Crosshairs | Pay attention to investor sentiment shifts | Composite lines reveal more accurate information
Part 3: Candlestick Chart Signals for Successful Investments
01 The most important price is the 'closing price'
Candlesticks dominate the market | The "closing price" is the price most market participants consider appropriate | The length of the tails determines when to buy or sell.
02 Trading is all about timing.
If you're impatient, you lose. Those who know the resistance lines dominate the market.
03 Pay attention to the candle position
Just because a long bullish candle appears doesn't mean it's always time to buy. Even the same long bullish candle can have completely different meanings depending on its location.
Part 4: Reading Composite Lines on Candlestick Charts
01 Candles indicating a bottom
1.
Knocking on the three emptinesses | 2.
3 consecutive long candlesticks | 3.
Long black candle with a bearish bullish candle | 4.
The morning star that announces the dawn | 5.
Rising Crosshair | 6.
A long candle that conceived a morning star | 7.
Lift up | 8.
Line of force | 9.
A long candle that gives birth to a bearish candle | 10.
Gap downtrend followed by a long bearish candlestick | 11.
Low-cost watchtower | 12.
Gap rising candle after low-price mixed tax | 13.
Gap rising candle after weak consolidation | 14.
Long bullish candlestick following a crosshair after a series of declines | 15.
Counterattack Line | 16.
Long bullish candlestick with a negative candlestick | 17.
Push beekeeping
02 Candlesticks that appear in the early stages of an upward trend
1.
Red Three Soldiers | 2.
Five consecutive bullish candles after a bearish trend | 3.
Press line | 4.
Bullish Market Insertion Line | 5.
Ascension Sambeop (上昇三法) | 6.
Breaking through the cover | 7.
Rising candlestick shoulder strap | 8.
Yin candlestick shoulder straps after a bullish candlestick | 9.
Crosshairs after a long bullish candlestick in a bullish market | 10.
Mixed Samsung in a rising market
03 Candlesticks appearing in the rising market maturity phase
1.
Gap Rising Twin Candlesticks | 2.
Gap Rising Consecutive Negative Candlesticks | 3.
Consecutive long bullish candlesticks in a bull market | 4.
The inverted hammer that gave birth to beekeeping
04 Candles hinting at the ceiling
1.
3 consecutive jumps | 2.
8 consecutive highs | 3.
Crosshairs during high price renewal | 4.
Dead End | 5.
The Black Three Diseases of a Rising Market | 6.
Hanging Beekeeping Hammer | 7.
Bullish Gap Rising Candlestick | 8.
Farewell | 9.
Long-term beekeeping, the birthplace of beekeeping | 10.
Long bullish candlestick with a bearish candlestick | 11.
Long yin candle with a bullish sign | 12.
Counterattack after consecutive negative candlesticks | 13.
Gap Rising After a Long Bullish Candlestick | 14.
A long negative candlestick appears after a long positive candlestick with a gap upward.
05 Candlestick breaking out of a downward trend after hitting the ceiling
1.
Stab in | 2.
Gap down, three red candles followed by a long red candle | 3.
The Three Laws of Descending | 4.
Beating the Three Brothers | 5.
Consecutive Shoulder Straps in a Bear Market | 6.
Bait Rod | 7.
Crosshairs in the early stages of a decline | 8.
Gap Down Twin Candlesticks | 9.
Mixed Samsung in a Bear Market | 10.
Consecutive negative candlesticks in a rising market | 11.
Pushing candlestick
Epilogue: Candlestick charts that provide answers in moments of worry.
Why You Should Read Candle Psychology: The Editor's Note
Detailed image
Into the book
To be successful, you must thoroughly understand the nature, characteristics, and habits of investments, buy at the lowest price, which is the optimal time to buy, and sell at the highest price, which is the optimal time to sell. You must also be patient and wait until the optimal time arrives.
To know this time, you must cultivate knowledge, thinking skills, foresight, judgment, patience, and execution skills.
--- From "Homma Munehisa (Founder of Candlestick Charts)"
Even if we try to predict investor sentiment and apply it to real-world situations, we need a standard to objectively judge the psychological state.
In this book, the standard was found in candlestick charts.
Candlestick charts provide a constant stream of signals, including the underlying bull and bear markets, the power dynamics between buyers and sellers, spot and futures trading in the market, supply and demand balances including credit balances and open interest, the market's reaction to the release of materials, and even investor sentiment.
Nothing else shows the investor's psychological state so purely as candlestick charts.
Therefore, by reading investor sentiment ahead of others, you can get a general idea of the situation and buy before others do, allowing you to increase your buying power with ease when the majority of investors get tired of waiting and rush to sell.
Conversely, while everyone else is euphoric about the expected rise, you can still make a cool-headed judgment and make a profit.
--- From "Part 1: Understanding Investor Psychology Reveals Cycles"
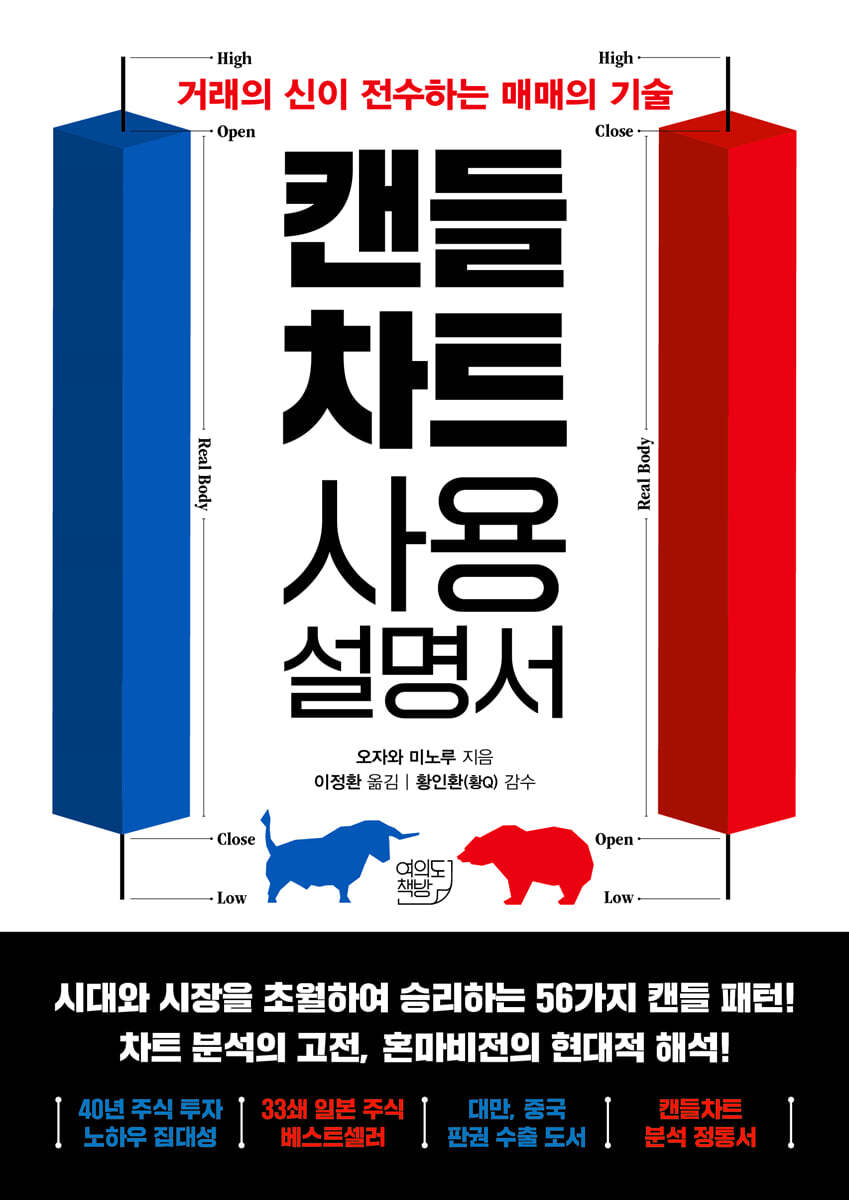
The body created by the opening and closing prices reflects market sentiment. If the opening price is higher than the closing price, it is displayed in blue (black if displayed in black and white), and if the closing price is higher than the opening price, it is displayed in red (white if displayed in black and white).
If the opening and closing prices are the same, they are indicated by a line.
When the opening and closing prices are the same, it is called a 'Doji'.
That is, if the stock market shows strong buying pressure throughout the day, the closing price will be high.
In the opposite situation, the low price becomes the closing price.
High and low prices are the result of resistance above the price and support below the price.
The tail (also called a shadow, leg, or whisker) that is created when the high and low prices reach the body is called an upper tail if it is created above the body, and a lower tail if it is created below the body.
Japanese candlesticks are sometimes represented by a body, while American candlesticks are sometimes represented by just a line.
--- From "Part 2: You only need to know one candlestick chart"
Typically, prices fluctuate after the first transaction based on various news, rumors, and other factors.
And by the time the trading closes, the factors that have moved the price have fully penetrated market participants.
Therefore, investors who are well-versed in market conditions carefully consider whether the market price of the stocks they hold is relatively high or low in light of the current market environment, and whether that price can be maintained in the future, and adjust their positions accordingly.
Since these transactions are usually in the opposite direction of the current price flow, there are many cases where the price flow changes as the trading end time approaches.
If this change is unexpected for investors, they may be momentarily taken aback.
Some investors trade to secure profits or minimize losses.
However, investors who are confident in their own views do not take any action other than adjusting their positions as necessary.
--- From "Part 3: Candlestick Chart Signals that Lead to Successful Investments"
Keeping in mind the points we've discussed so far, let's analyze the composite line on the candlestick chart.
Although single candlesticks are significant, when they are combined into a composite line (composite line), they more accurately convey the true picture of the market, reflecting changes in investor sentiment and specific actions.
The various candle shapes on the chart used ‘weekly candles’.
Also, because it is important to consider where in the price cycle they appear, the order of candlestick patterns is arranged, if possible, following the previously introduced maxim: “Bull markets are born in pessimism, grow in skepticism, mature in optimism, and die in happiness.”
To know this time, you must cultivate knowledge, thinking skills, foresight, judgment, patience, and execution skills.
--- From "Homma Munehisa (Founder of Candlestick Charts)"
Even if we try to predict investor sentiment and apply it to real-world situations, we need a standard to objectively judge the psychological state.
In this book, the standard was found in candlestick charts.
Candlestick charts provide a constant stream of signals, including the underlying bull and bear markets, the power dynamics between buyers and sellers, spot and futures trading in the market, supply and demand balances including credit balances and open interest, the market's reaction to the release of materials, and even investor sentiment.
Nothing else shows the investor's psychological state so purely as candlestick charts.
Therefore, by reading investor sentiment ahead of others, you can get a general idea of the situation and buy before others do, allowing you to increase your buying power with ease when the majority of investors get tired of waiting and rush to sell.
Conversely, while everyone else is euphoric about the expected rise, you can still make a cool-headed judgment and make a profit.
--- From "Part 1: Understanding Investor Psychology Reveals Cycles"
The body created by the opening and closing prices reflects market sentiment. If the opening price is higher than the closing price, it is displayed in blue (black if displayed in black and white), and if the closing price is higher than the opening price, it is displayed in red (white if displayed in black and white).
If the opening and closing prices are the same, they are indicated by a line.
When the opening and closing prices are the same, it is called a 'Doji'.
That is, if the stock market shows strong buying pressure throughout the day, the closing price will be high.
In the opposite situation, the low price becomes the closing price.
High and low prices are the result of resistance above the price and support below the price.
The tail (also called a shadow, leg, or whisker) that is created when the high and low prices reach the body is called an upper tail if it is created above the body, and a lower tail if it is created below the body.
Japanese candlesticks are sometimes represented by a body, while American candlesticks are sometimes represented by just a line.
--- From "Part 2: You only need to know one candlestick chart"
Typically, prices fluctuate after the first transaction based on various news, rumors, and other factors.
And by the time the trading closes, the factors that have moved the price have fully penetrated market participants.
Therefore, investors who are well-versed in market conditions carefully consider whether the market price of the stocks they hold is relatively high or low in light of the current market environment, and whether that price can be maintained in the future, and adjust their positions accordingly.
Since these transactions are usually in the opposite direction of the current price flow, there are many cases where the price flow changes as the trading end time approaches.
If this change is unexpected for investors, they may be momentarily taken aback.
Some investors trade to secure profits or minimize losses.
However, investors who are confident in their own views do not take any action other than adjusting their positions as necessary.
--- From "Part 3: Candlestick Chart Signals that Lead to Successful Investments"
Keeping in mind the points we've discussed so far, let's analyze the composite line on the candlestick chart.
Although single candlesticks are significant, when they are combined into a composite line (composite line), they more accurately convey the true picture of the market, reflecting changes in investor sentiment and specific actions.
The various candle shapes on the chart used ‘weekly candles’.
Also, because it is important to consider where in the price cycle they appear, the order of candlestick patterns is arranged, if possible, following the previously introduced maxim: “Bull markets are born in pessimism, grow in skepticism, mature in optimism, and die in happiness.”
--- From "Part 4: How to Read the Composite Line of a Candlestick Chart"
Publisher's Review
Identify winning buy and sell timings with candlestick chart analysis!
What is the key to reading market psychology and forming trades a half step ahead?
"Candlestick Chart User's Guide" targets a wide range of audiences, from beginners to more experienced traders seeking to improve their trading skills. Therefore, it focuses on the most familiar market: the stock market.
However, in reality, due to the nature of the chart, it is composed of content that can be immediately utilized in all markets.
Readers who want to utilize candlesticks in exchange rates or futures can read by replacing 'stocks' with the trading targets.
Part 1 examines market cycles in relation to investor psychology and behavior.
Investors often place large buy orders near the price ceiling and sell orders near the price floor.
At first glance, the world of stocks seems to require very simple actions: 'buy low and sell high (BLASH)', 'sell high and buy low.'
But in reality, there are many cases where trading opportunities are missed for psychological reasons.
Herein lies the secret to joining the "successful investment group that wins in the market."
To further understand this investor psychology, we attempted to identify its factors by analyzing it using various candlestick chart models.
Part 2 explains the basic form of candlestick charts.
In particular, we will look specifically at what each part of the candle means.
In a market, there must be an opening price, a high price, a low price, and a closing price.
A candle is a shape that contains these four things.
Additionally, the basic element in analysis using candlestick charts is the shape of each candlestick (a single line), which suggests the reason for the formation of such a candlestick, the state of the market supply and demand balance, how investors are reacting, and how the market will develop in the future.
It also provides information on the long-term candlestick pattern, the crosshairs, and the composite line that combines them.
Part 3 introduces the technical secrets for joining the "successful investment group" in the world of moving prices, based on candlestick charts.
Typically, after the first transaction, the stock price fluctuates based on various news, rumors, and other factors, and ends at the "closing price," which is the price deemed most appropriate in the current market environment.
As a market participant, you must always be nimble.
But at the same time, you have to let go of your anxious feelings.
Being anxious can ultimately cloud your judgment and lead to unwanted trading.
To enter the Holy Spirit group, one must maintain composure and possess the means to objectively analyze the market price, and candlestick charts are one of the most suitable materials for this purpose.
Finally, in Part 4, we introduce the composite line of the candlestick chart, which densely condenses the core of the price, including investor psychology and behavior, and hints at future price trends, along the price cycle.
We show how actual candlestick charts move by looking at the movements of actual company stock prices, and added detailed explanations for each one.
In particular, it is composed of content that allows you to understand candlestick charts by digging deeper into their core and examining how trading behavior based on the subtle psychological state of investors significantly influences subsequent price formation.
56 candlestick chart analyses organized in one volume!
Read the psychology hidden in charts and ride the market's flow with 40 years of stock investment know-how!
What should a beginner in stocks look at first when reading candlestick charts?
What candlestick shapes do typical bullish and bearish patterns have?
When do experts sell and when do they buy?
"Candlestick Chart User Manual" analyzes 56 different candlestick chart shapes that are actually seen in the market, and then analyzes the meaning of each shape in the overall market, along with the behavior and psychological state of buyers that these candlesticks reveal.
Additionally, through situation analysis, you can check how the market will perform in the future through actual cases.
You can see what candlestick patterns were formed when negative news hit last week, how the market reacts to positive news, and how to react whenever the market is shaken by large buy or sell orders.
Additionally, at the end of each candlestick chart analysis, we provide advice on how to act if this type of market reappears.
Clearly, transactions occur because someone is selling and someone is buying at the same price range.
Although the materials are the same, greed and fear cause changes in trade (supply and demand).
Candlesticks are a psychological trend and represent the unmistakable market momentum that has occurred over a certain period of time.
One candle can be used to read psychology, two can be used to read foreshadowing, and three or more can be used to read timing.
Join the Seongtoo group based on the "Candlestick Chart User Manual" that provides realistic explanations with various examples!
GOODS SPECIFICS
- Date of issue: February 11, 2025
- Page count, weight, size: 304 pages | 145*205*25mm
- ISBN13: 9791198944283
- ISBN10: 1198944285
You may also like
카테고리
korean


korean

![ELLE 엘르 스페셜 에디션 A형 : 12월 [2025]](http://librairie.coreenne.fr/cdn/shop/files/b8e27a3de6c9538896439686c6b0e8fb.jpg?v=1766436872&width=3840)


