

Learning stock charts for beginners
 |
Description
Book Introduction
From volume analysis to the use of auxiliary indicators, Chart Analysis Fundamentals from YouTuber "Kind Jaeseung," who has invested 170,000 shares. After a long winter, the stock market is heating up again. Investors who were not discouraged by the prolonged bear market are once again jumping into stock investment with the expectation of successful returns. It is especially important to lay the foundation for investment at times like these. "Stock Charts for Beginners" is a book that provides a friendly explanation of chart analysis methods, which are the basis of stock investment. This book introduces various tools for identifying trading opportunities through charts, maximizing profits and avoiding losses, including understanding the most basic yet crucial elements of stock charts: volume and moving averages. Technical analysis, a method of investing in stocks learned through various real-world stock charts, is a valuable tool for all investors, from beginners new to the stock market to experienced investors seeking effective trading strategies. Jaeseung's friendly explanations, along with YouTube video lectures, will provide you with a solid foundation for jumping into stock investing. |
- You can preview some of the book's contents.
Preview
index
Before you start
Stock Terminology
Part 1: Trading Volume Analysis
01 Read momentum through trading volume.
02 Correlation between trading volume and stock price
03 Finding Stocks to Invest in Through Volume Analysis
04 When to buy and when to sell based on trading volume
05 Shh! The Secret of Bulk Trading and the Characteristics of Rapidly Rising Stocks
Part 2: Trend Analysis
06 Knowing the trend is the shortcut to successful investing.
07 Developing a trading strategy using trend lines
08 Finding Strong Stocks Using Trends
09 In this case, get out quickly.
10 How far will my stock go?
Part 3: A Stock Journey with Candles
First step of 11 candles
12 Basic candlestick patterns indicating a reversal
13 When to buy and when to sell with a reversal candlestick
14 Star-shaped reversal candlesticks
15 Knowing the Sustainable Type Shows Profit
Part 4: Trading Methods Using Moving Averages
16 Looking at the moving average line, you can see the stock price movement.
17 Stock Price Flow and Granville's Law
Just know the 18 principles! Moving average support and resistance.
What happens when 19 moving averages meet?
20. Make money using the gap
Part 5 Auxiliary Indicators (1) General Type
21 Highest Peak Stochastic of Short-Term Indicators
RSI measures the strength of price movements
Finding the right time to buy and sell through the 23 CCI
Knowing the commonalities of the 24 auxiliary indicators makes charts easier to understand.
25 DMI that captures trend direction and strength simultaneously
26 Parabolic SAR to identify trends through parabolas
27 Bollinger Bands: A Trading Technique Using Band Width
Part 6 Auxiliary Indicators (2) Advanced
28 MACD, the synonym for medium-term indicators
29 OBV, the synonym for volume analysis indicator
VR that complements the shortcomings of 30 OBV
31 Essential Resources for Mid-Term Investors: Three-Line Conversion Chart
32 Momentum indicators leading the price
33 Psychological Lines for Reading Market Psychology
ROC indicating the strength of the 34th price
Part 7 Pattern Analysis (1) Reversal
Let's learn the basics of pattern analysis from the beginning.
36 The basic types of inversion are head and shoulders and reverse head and shoulders.
37 Double top and double bottom types, variations of the head and shoulders type
38 A circular pattern that is completed over a long period of time
39 V-shaped pattern with high stock price fluctuations
Part 8 Pattern Analysis (2) Continuous
40 Triangle, a representative continuation pattern
41 Flag-shaped formation in a short period of time
42 Pennants instead of flags: Pennant type
43 Wedge-shaped with a slope in the same direction
Rectangle taking a break inside the box 44
45 Analysis of Ten Patterns for Rising Stocks
Appendix Elliott Wave Theory
Detailed image
Into the book
A chart captures the dynamic nature of stock prices in a static state, and continuously records the footsteps of the stock price.
So the chart clearly shows what other investors have been doing.
For example, we constantly talk about whether there is a strong buying force or whether there are many people trying to sell.
Therefore, technical analysis is invaluable for identifying investment opportunities, as it not only analyzes the rhythms and patterns of past stock price movements, but also predicts future price movements.
--- p.5~6
Typically, in an uptrend, the more lows that create a trend line, the more reliable the trend line is, and the longer the trend line, the greater the reliability.
There is also a difference in confidence in the slope of the trend line. There is no correct answer, but it is said that the closer an upward trend line gets to a 45-degree slope, the higher the confidence.
If the upward trend line is too steep, it can easily break down in a short period of time, and if the slope is too gentle, the trend is weak and it is difficult to be certain that it is an upward trend.
--- p.68
A candlestick is a complete form created by displaying the four most important prices during the session: 'opening price', 'closing price', 'high price', and 'low price'. This provides useful data that allows one to easily understand the buying and selling movements of the day.
As in the candlestick above, when the closing price is higher than the opening price, it is called a positive candlestick (red), and as in the chart below, when the closing price is lower than the opening price, it is called a negative candlestick (blue).
--- p.110
Just as in life, the past always influences the present, and the present always influences the future, so too in the stock market, the moving average, which is the past performance of stock prices, moves in a certain relationship with the current stock price, and this can be used to predict the future direction of stock prices.
You can find traces of support and resistance in it and apply them to future trading.
--- p.203
People looked back at charts of past stock price movements and discovered trends that had a certain pattern.
And we also found that this pattern is not limited to that one sport, but appears similarly in other sports as well.
These charts with a certain shape were standardized and made into a model, and in the stock market, this is called a pattern.
--- p.347
Publisher's Review
A runaway stock market, an opaque market
The secret to successful investing is
Let's start with the basics of 'stock chart analysis'!
After a year-long bear market in 2022, the stock market is on the rise again, and people's interest in investing has also increased once again.
According to media reports, "debt-to-equity" investments, which had been rapidly increasing in 2020, are on the rise again, and 65% of office workers with stock investment experience said they check charts even during work.
However, many of the factors that contributed to last year's downturn remain unresolved, and the future of the current bullish stock market remains uncertain.
What does it take to remain steadfast and achieve successful stock investing in this chaotic environment?
The investment market is a battlefield where it is unclear whether a "perfect" result can be achieved even with a wealth of skills and knowledge.
But the more opaque and confusing the market becomes, the more important it is to focus on the fundamentals.
The most fundamental aspect of stock investment is stock charts, and therefore, "technical analysis," which analyzes charts, is the easiest way to predict the future using past stock price information, and is a very important skill.
Author of the 20-year bestseller Chart Analysis
Investment education YouTuber chosen by 170,000 subscribers
A 'Friendly' Technical Analysis Lecture
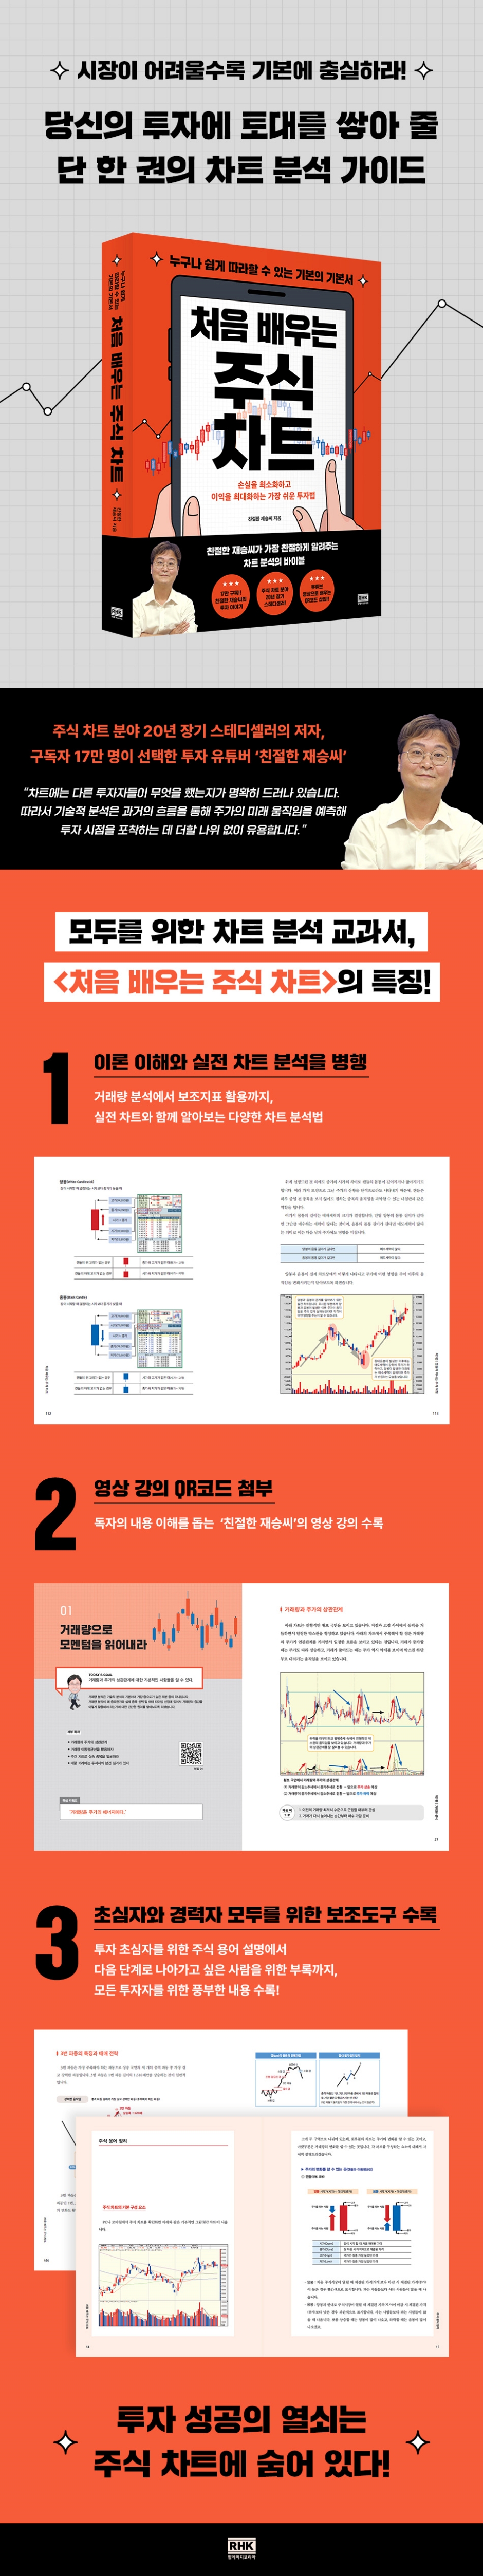
The author of 『Stock Charts for Beginners』, 'Kind Jaeseung', is the co-author of 『Stock Charts Are Easy Once You Know Them』, a book that has been consistently loved by investors for 20 years in the field of technical analysis. He is also an investment education YouTuber chosen by 170,000 subscribers for his outstanding insight into stock chart analysis and the US stock market.
This book helps readers easily understand technical analysis, which can be complex and ambiguous, through the author's friendly explanations.
Furthermore, to help readers better understand technical analysis and achieve successful investment, we utilize various real-world charts to demonstrate how technical analysis can be used in real-world investment situations to determine trading timing.
Additionally, the chart analysis lecture by YouTuber 'Kind Jaeseung' is provided in QR code format, helping investors understand chart analysis more easily by using books and audiovisual materials together.
A clear solution for a clear goal
The A to Z of Chart Analysis Techniques for Successful Investment
Every investor has only one goal: to make a sure profit.
To achieve clear goals, they collect a wealth of information through various channels, including public disclosures, corporate information, and performance data.
While there is significant variation in the information available to investors, depending on their investment experience and access to financial infrastructure, there is one key piece of information that is available to all investors at the same time and under the same conditions.
This is the stock price information recorded on the ‘stock chart’.
A chart captures dynamic stock prices in a static state, continuously recording the footsteps of a stock's price.
The chart clearly shows not only the stock's past performance, but also what other investors have done with it.
Therefore, the success or failure of an investment depends on how investors utilize the stock price information obtained through charts.
"Stock Charts for Beginners" begins with the fundamentals of chart analysis, utilizing trading volume and moving averages. It then moves on to teaching how to analyze the underlying meaning of candlesticks, determine stock trends, and understand various patterns in stock charts, utilizing numerous auxiliary indicators.
This book covers everything from A to Z of stock chart analysis.
Therefore, readers who understand the contents of the book will be able to make successful, rational investments by appropriately utilizing the information provided by the charts.
The secret to successful investing is
Let's start with the basics of 'stock chart analysis'!
After a year-long bear market in 2022, the stock market is on the rise again, and people's interest in investing has also increased once again.
According to media reports, "debt-to-equity" investments, which had been rapidly increasing in 2020, are on the rise again, and 65% of office workers with stock investment experience said they check charts even during work.
However, many of the factors that contributed to last year's downturn remain unresolved, and the future of the current bullish stock market remains uncertain.
What does it take to remain steadfast and achieve successful stock investing in this chaotic environment?
The investment market is a battlefield where it is unclear whether a "perfect" result can be achieved even with a wealth of skills and knowledge.
But the more opaque and confusing the market becomes, the more important it is to focus on the fundamentals.
The most fundamental aspect of stock investment is stock charts, and therefore, "technical analysis," which analyzes charts, is the easiest way to predict the future using past stock price information, and is a very important skill.
Author of the 20-year bestseller Chart Analysis
Investment education YouTuber chosen by 170,000 subscribers
A 'Friendly' Technical Analysis Lecture
The author of 『Stock Charts for Beginners』, 'Kind Jaeseung', is the co-author of 『Stock Charts Are Easy Once You Know Them』, a book that has been consistently loved by investors for 20 years in the field of technical analysis. He is also an investment education YouTuber chosen by 170,000 subscribers for his outstanding insight into stock chart analysis and the US stock market.
This book helps readers easily understand technical analysis, which can be complex and ambiguous, through the author's friendly explanations.
Furthermore, to help readers better understand technical analysis and achieve successful investment, we utilize various real-world charts to demonstrate how technical analysis can be used in real-world investment situations to determine trading timing.
Additionally, the chart analysis lecture by YouTuber 'Kind Jaeseung' is provided in QR code format, helping investors understand chart analysis more easily by using books and audiovisual materials together.
A clear solution for a clear goal
The A to Z of Chart Analysis Techniques for Successful Investment
Every investor has only one goal: to make a sure profit.
To achieve clear goals, they collect a wealth of information through various channels, including public disclosures, corporate information, and performance data.
While there is significant variation in the information available to investors, depending on their investment experience and access to financial infrastructure, there is one key piece of information that is available to all investors at the same time and under the same conditions.
This is the stock price information recorded on the ‘stock chart’.
A chart captures dynamic stock prices in a static state, continuously recording the footsteps of a stock's price.
The chart clearly shows not only the stock's past performance, but also what other investors have done with it.
Therefore, the success or failure of an investment depends on how investors utilize the stock price information obtained through charts.
"Stock Charts for Beginners" begins with the fundamentals of chart analysis, utilizing trading volume and moving averages. It then moves on to teaching how to analyze the underlying meaning of candlesticks, determine stock trends, and understand various patterns in stock charts, utilizing numerous auxiliary indicators.
This book covers everything from A to Z of stock chart analysis.
Therefore, readers who understand the contents of the book will be able to make successful, rational investments by appropriately utilizing the information provided by the charts.
GOODS SPECIFICS
- Date of issue: April 21, 2023
- Page count, weight, size: 464 pages | 1,144g | 188*243*23mm
- ISBN13: 9788925576596
- ISBN 10: 8925576597
You may also like
카테고리
korean


korean

![ELLE 엘르 스페셜 에디션 A형 : 12월 [2025]](http://librairie.coreenne.fr/cdn/shop/files/b8e27a3de6c9538896439686c6b0e8fb.jpg?v=1766436872&width=3840)


