

Bollinger Bands Investment Technique
 |
Description
Book Introduction
Success or failure depends on how a person who wants to trade stocks uses Bollinger Bands!
Trading will change when you let go of your prejudices and open your eyes to new trading insights.
The revised edition of "Bollinger Bands Investment Technique" has been released.
“In investing, the holy grail is the system you create yourself.
“There is no other Holy Grail.”
- John Bollinger, author of "Bollinger Bands" and creator of Bollinger Bands
Bollinger Bands are one of several technical analysis indicators, and are still used by countless traders around the world in stock, futures, and currency markets.
If it's true that Bollinger Bands are not worth using because they have a strong lag, why are so many of the world's most famous professional and professional traders still using them?
As long as you acknowledge that Bollinger Bands aren't some magic formula, you can successfully utilize them to your advantage.
The biggest advantages of Bollinger Bands can be broadly categorized into four.
-You can use Bollinger Bands to predict entry and liquidation points.
-You can identify overbought and oversold conditions by looking at Bollinger Bands.
Bollinger Bands have limitations as an indicator that only displays price and volatility, excluding other additional information. However, when combined with other indicators to compensate for these shortcomings, they can become an excellent trading tool.
Bollinger Bands are a relatively simple and globally renowned trading tool, accessible to professional traders, professional traders, and individual investors everywhere.
"Bollinger Bands Investment Technique" is a book that was fully translated from the original book written by John Bollinger, the creator of "Bollinger Bands."
Investors interested in learning more about Bollinger Bands can learn directly from the original author about their development ideas, optimal setup methods for increasing winning rates, and indicator selection methods.
As with most great inventions, Bollinger Bands have the advantage of simplicity.
In particular, the three core trading techniques Bollinger provides will be useful information for investors, as anyone can easily understand and utilize them.
The revised edition of "Bollinger Bands Investment Technique" is a new edition with a new cover to welcome the new year of 2021.
- You can preview some of the book's contents.
Preview
index
Praise for this book
Recommendation
Reviewer's note
List of Figures and Tables
Author's Preface
Acknowledgements
Part 1: Analyzing the Market
Chapter 1 Introduction
Data used in Chapter 2 analysis
Chapter 3: Investing and Trading Periods and Time Frames
Chapter 4: Is Timeless Guidance Possible?
Chapter 5: Your Own Way is the Best Guide
Part 2: The Basics of Bollinger Bands
Chapter 6: The History of Trading Bands, Envelopes, and Channels
Chapter 7: How to Build Trading Bands
Chapter 8: Indicators that can be derived from Bollinger Bands: %b and Band Width
Chapter 9: Bollinger Bands and Statistical Rules
Part 3: Practical Use of Bollinger Bands
Chapter 10: The Crucial Key to Pattern Identification
Chapter 11: Filtering Out Irrelevant Information with Stock Price Filters
Chapter 12: Capturing a Typical W-Shaped Bottom Pattern
Chapter 13: Capturing a Typical Ceiling M-Shaped Pattern
Chapter 14: Riding the Bands Signaling a Trend's Continuation
Squeeze using the contraction and expansion of the 15-band
Chapter 16 Trading Techniques I: Volatility Breakouts
Part 4: Combining Bollinger Bands and Indicators
Chapter 17: Indicators that Confirm Bollinger Band Signals
Chapter 18: Volume Indicators Used with Bollinger Bands
Chapter 19 Trading Techniques II: Trend Following
Chapter 20 Trading Techniques III: Reversal
Part 5: Advanced Techniques for Day Traders
Chapter 21: Standardizing Indicators Using Bollinger Bands
Chapter 22: Techniques for Day Traders
Part 6 Summary
Fifteen Basic Principles
In closing
supplement
Americas
Glossary
References
About the Author
pattern cards
Bollinger Bands formula
Calculation formula by indicator
Detailed image
Into the book
This book by Bollinger is considered one of the classics of modern investment techniques.
It may be a bit late to introduce such a famous work to Korea, but it is a very welcome development.
Through this book, readers will learn why Bollinger Bands are an excellent investment technique and how John Bollinger gained insight into the essence of stock prices.
Bollinger Bands define the variables that are always present in the volatile stock market and provide a predictable target to determine the extent and speed of movement.
---From 'The Supervisor's Note'
The goal of this book is to help investors avoid various pitfalls.
For example, there is a trap called ‘buy low’.
If you fall into this trap, you end up buying at a "low" price and then watching the stock price continue to plummet.
Investors who fall into the 'high price selling' trap see the stock price continue to soar after selling.
Therefore, the traditional, emotional approach to the market must be replaced by a relative framework, one that allows for rational investment decisions based on precise stock price analysis without relying on absolute truth.
You can buy low and sell high.
But this is only possible in a relative framework, so the dependence on absolute laws will be reduced to a minimum.
The 'high' can be determined by comparing it to the upper end of the trading band, and the 'low' is determined by the lower end.
We will also suggest various ways to help you tailor this framework to your personal preferences and risk/reward criteria.
---From 'Analyzing the Market'
To distinguish patterns, you need to keep in mind the price highs and lows that follow the momentum highs and lows.
Usually, when a stock price falls, the downward momentum accelerates and falls to the first low. This is when the momentum reaches its peak and trading volume is usually very high.
After that, the stock price recovers for a while and then falls again, hitting a low.
This second low could set a new low, but even if it does, momentum will slow sharply and trading volume will also plummet.
In many cases, the tops and bottoms of momentum occur outside the Bollinger Bands, and the subsequent tops and bottoms of the stock price, or reversal points, occur within the Bollinger Bands.
---From 'The Crucial Key to Pattern Identification'
So what should we do when a trend is continuing? Perhaps the most challenging part of trading management is the period when a trend persists.
One of the most common mistakes when using bands, envelopes, or channels is to blindly sell at the upper band tag or buy at the lower band tag.
If a tag is part of a larger pattern or is confirmed by an indicator, it can actually be a buy or sell signal.
But again, that might not be the case.
Band tags by themselves do not serve any purpose as a signal.
As the uptrend continues, upper band tags will continue to occur and there will usually be several days when the closing price breaks out of the band.
During a stock price decline, the stock price frequently tags the lower band or breaks below the lower band.
When a stock price breaks out of the band, it is called a leg.
When the closing prices break out of the bands like this, it is a continuation signal, not a reversal signal.
While closes outside the bands may be the first part of a pattern that leads to a reversal signal, they are usually not reversals in and of themselves.
A pattern can be formed only when unconfirmed, or non-confirmed, peaks or valleys occur within the band.
---From 'Riding the Band That Signals a Continuation of the Trend'
The three trading techniques I present work like this:
In Technique 1, buy when the upper band is broken and sell short when the lower band is broken downward.
Technique II approaches the upper band and buys on strength only when the indicator confirms the strength.
When the stock price approaches the lower band, sell on weakness only when the indicator confirms weakness.
Technique III uses a W-shaped pattern to buy near the lower band when the indicator clearly confirms the setup, and sell near the upper band when a series of tags occur at the upper band and bearish indicators accompany it.
We will also introduce a variation of this technique to identify buy and sell points without having to check whether the indicator confirms the band tags.
--- From the text
Publisher's Review
The essence of trading bands, the investment tool with the highest winning percentage in Wall Street history.
The first complete translation of the original Bollinger Bands, written by Bollinger himself!
“Bollinger Bands have been considered the most trusted stock price prediction technique by veteran traders in global financial markets for the past 30 years.
John Bollinger reveals the secrets to utilizing this excellent investment tool.”
There was a group of traders who shook up Wall Street in the mid-1980s.
The Turtle Group, led by Richard Dennis, a giant in the futures market at the time, turned Wall Street upside down by transforming themselves into professional traders, earning tens of millions of dollars in profits after just two weeks of training.
The Turtle Group's returns are based on the Donchian Channel, which John Bollinger further developed into the Bollinger Band, the quintessential investment tool utilizing bands and envelopes.
Curtis Faith, one of the most accomplished original Turtle members, published his 2007 book verifying the performance of several systems and revealing the results.
Among them, the Bollinger breakout entry system recorded the highest return of 52.2 percent.
Additionally, in terms of win rate (entering the market with an advantage), the Bollinger Channel breakout far outperformed the Donchian trend system at 54.6%, compared to 39.7%.
Attempts to predict future movements by drawing lines above and below stock prices have been ongoing for a long time.
Examples include bands, channels, and envelopes, but Bollinger Bands are currently considered the most advanced tool and an investment tool that flexibly adapts to market changes.
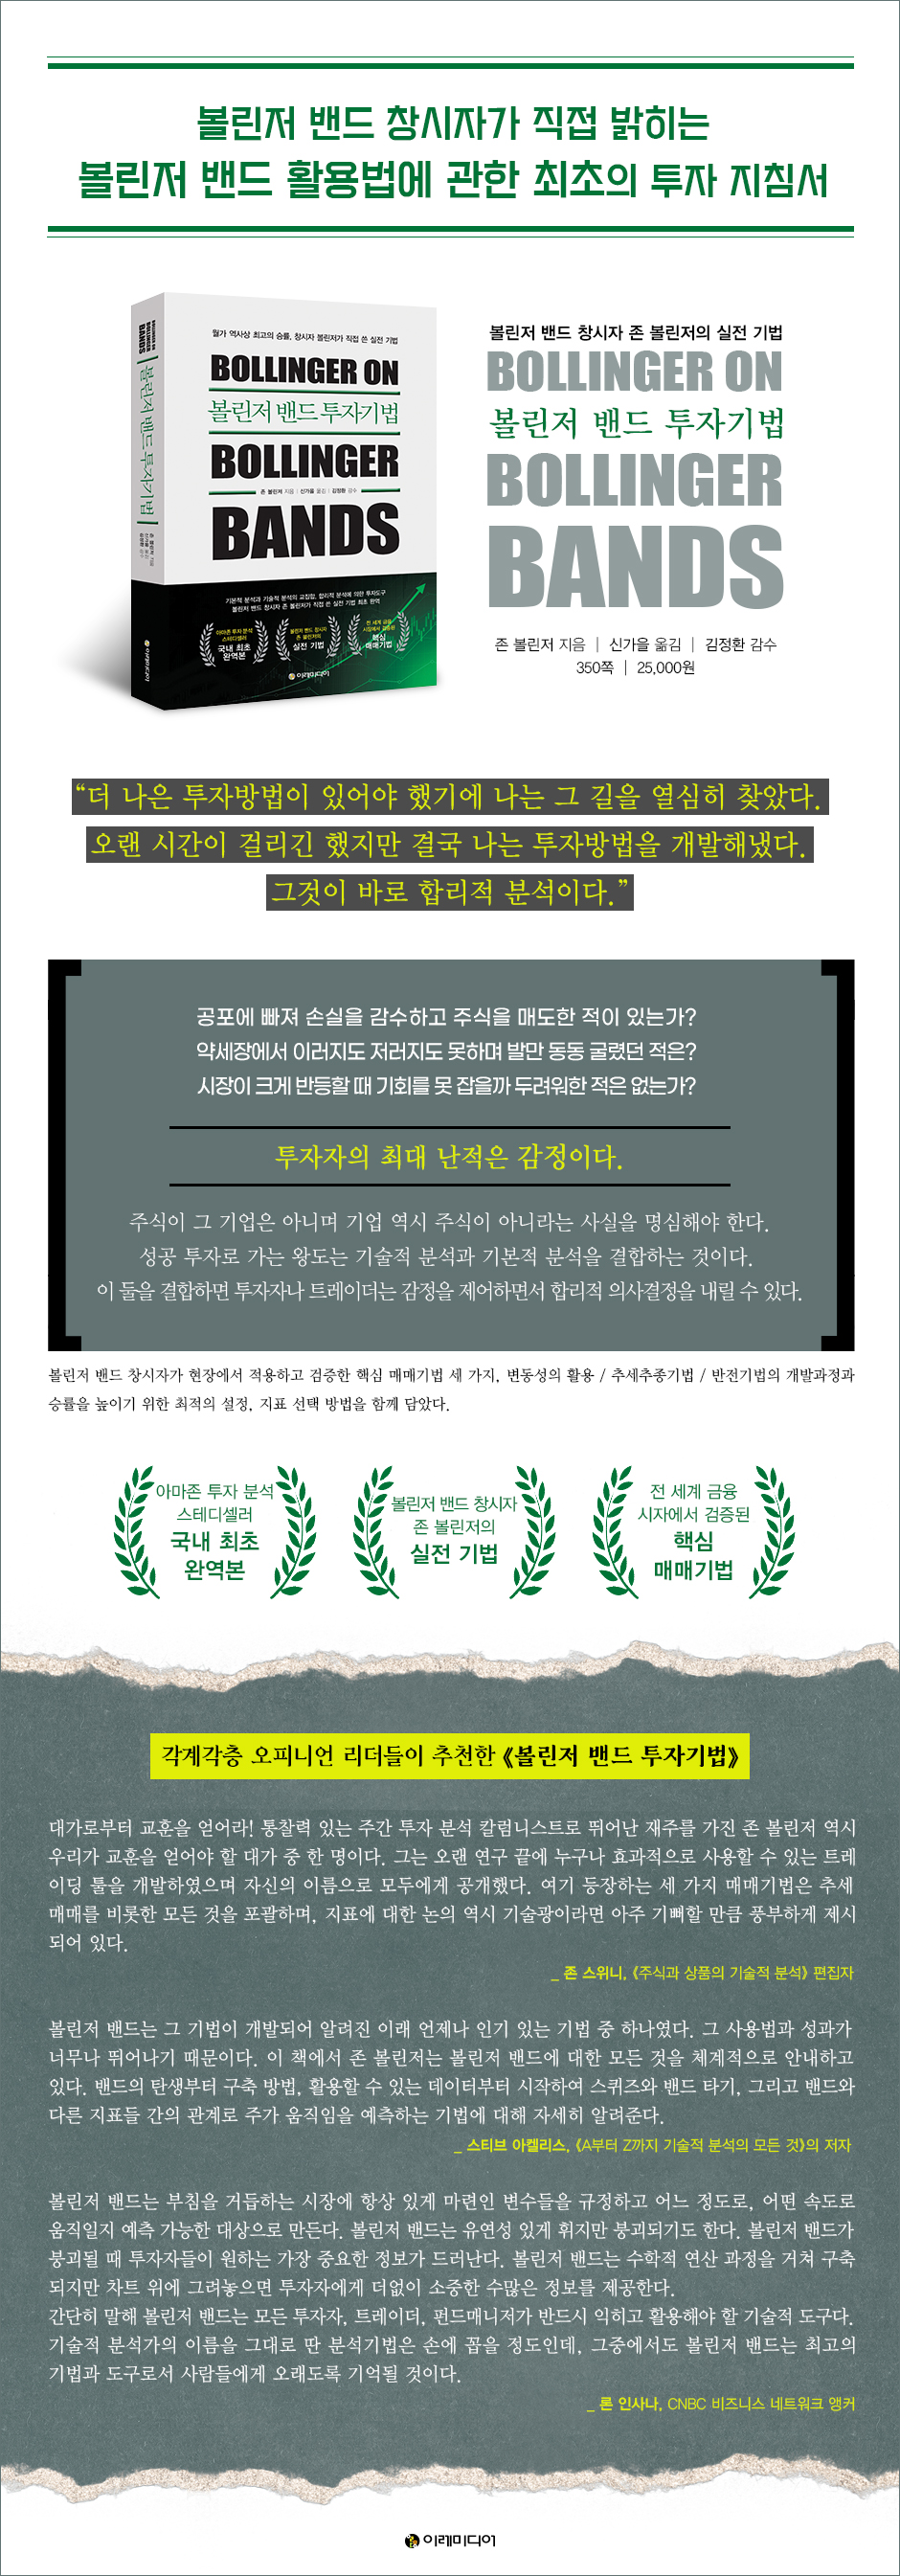
An investment tool based on rational analysis, combining fundamental and technical analysis.
There are two wings of market analysis: fundamental analysis and technical analysis.
Technical analysts look at stock prices, while fundamental analysts look at companies.
There is a clear connection between a company and its stock, but the stock is not the company, and the company is not the stock.
Therefore, analysis that is biased towards one side is more likely to be error-prone.
A rational way to view these in an integrated manner rather than dichotomously is through analysis using Bollinger Bands.
The data required to set Bollinger Bands are stock price, trading volume, and volatility.
When examining the technical aspects of stock prices and trading volume, volatility reflects corporate fundamentals and investor sentiment.
Additionally, Bollinger Bands, which combine these two, serve as an important foundation for rational decision-making.
What is the basis for determining whether a current stock price is a high or low? At what point can we say a stock is overvalued or undervalued? The relative framework that defines this is the upper and lower Bollinger Bands.
This book clearly shows how rational analysis can help you overcome investment obstacles.
Founder John Bollinger's three core trading techniques revealed!
Bollinger Bands are the most widely used and trusted investment tool among individual investors, institutional investors, and foreign investors alike.
So, who best understands the concept and application of Bollinger Bands? It's none other than John Bollinger himself, the inventor of the technique.
In this book, he reveals three core trading techniques he has applied and proven in the trading field.
Technique I utilizes the contraction and expansion of bandwidth, i.e. volatility.
As the band width narrows and passes through a dense zone, it is a method of buying when it breaks through the upper band and short selling when it breaks downward through the lower band.
Technique II is a trend-following technique that utilizes upper and lower bands and indicators.
This method involves buying when the indicator confirms the strength of the stock price as it approaches the upper band, and selling when the indicator confirms the weakness of the stock price as it approaches the lower band.
Technique III is a reversal technique that utilizes multiple band tags (contacts) and indicators.
A reversal can be predicted when the stock price touches the upper band several times but the indicator shows gradual weakness, or when the stock price touches the lower band several times but the indicator shows gradual strength.
In this book, Bollinger explains the process through which each technique was developed and explains the optimal setup and indicator selection methods to increase the winning rate.
As with most great inventions, Bollinger Bands have the advantage of simplicity.
The three core trading techniques are simple and clear, so anyone can easily understand and use them.
A must-read for all market participants utilizing Bollinger Bands.
This book is filled with unique investment techniques for traders and the author's unique insights as a professional trader with over 30 years of practical experience:
· The first systematic review of the theoretical underpinnings and practical applications of this innovative technical analysis tool.
· How to confirm the W-shaped bottom and M-shaped top pattern and utilize Bollinger Bands
· Strategic use of Bollinger Bands for short-, medium-, and long-term trading
· Three trading techniques with high winning rates, personally used and verified by the author.
· Indicators derived from Bollinger Bands, %b and Bandwidth Analysis
The key to investment analysis is to exclude emotions as much as possible and focus solely on market movements and facts to determine profit potential.
Since the introduction of technical analysis, no technique has guided investors along this path as accurately as Bollinger Bands.
The widespread popularity of Bollinger Bands is a testament to this.
This book provides tips, guidelines, and rules for applying Bollinger Bands to any investment strategy, making it a must-read for traders.
The first complete translation of the original Bollinger Bands, written by Bollinger himself!
“Bollinger Bands have been considered the most trusted stock price prediction technique by veteran traders in global financial markets for the past 30 years.
John Bollinger reveals the secrets to utilizing this excellent investment tool.”
There was a group of traders who shook up Wall Street in the mid-1980s.
The Turtle Group, led by Richard Dennis, a giant in the futures market at the time, turned Wall Street upside down by transforming themselves into professional traders, earning tens of millions of dollars in profits after just two weeks of training.
The Turtle Group's returns are based on the Donchian Channel, which John Bollinger further developed into the Bollinger Band, the quintessential investment tool utilizing bands and envelopes.
Curtis Faith, one of the most accomplished original Turtle members, published his 2007 book verifying the performance of several systems and revealing the results.
Among them, the Bollinger breakout entry system recorded the highest return of 52.2 percent.
Additionally, in terms of win rate (entering the market with an advantage), the Bollinger Channel breakout far outperformed the Donchian trend system at 54.6%, compared to 39.7%.
Attempts to predict future movements by drawing lines above and below stock prices have been ongoing for a long time.
Examples include bands, channels, and envelopes, but Bollinger Bands are currently considered the most advanced tool and an investment tool that flexibly adapts to market changes.
An investment tool based on rational analysis, combining fundamental and technical analysis.
There are two wings of market analysis: fundamental analysis and technical analysis.
Technical analysts look at stock prices, while fundamental analysts look at companies.
There is a clear connection between a company and its stock, but the stock is not the company, and the company is not the stock.
Therefore, analysis that is biased towards one side is more likely to be error-prone.
A rational way to view these in an integrated manner rather than dichotomously is through analysis using Bollinger Bands.
The data required to set Bollinger Bands are stock price, trading volume, and volatility.
When examining the technical aspects of stock prices and trading volume, volatility reflects corporate fundamentals and investor sentiment.
Additionally, Bollinger Bands, which combine these two, serve as an important foundation for rational decision-making.
What is the basis for determining whether a current stock price is a high or low? At what point can we say a stock is overvalued or undervalued? The relative framework that defines this is the upper and lower Bollinger Bands.
This book clearly shows how rational analysis can help you overcome investment obstacles.
Founder John Bollinger's three core trading techniques revealed!
Bollinger Bands are the most widely used and trusted investment tool among individual investors, institutional investors, and foreign investors alike.
So, who best understands the concept and application of Bollinger Bands? It's none other than John Bollinger himself, the inventor of the technique.
In this book, he reveals three core trading techniques he has applied and proven in the trading field.
Technique I utilizes the contraction and expansion of bandwidth, i.e. volatility.
As the band width narrows and passes through a dense zone, it is a method of buying when it breaks through the upper band and short selling when it breaks downward through the lower band.
Technique II is a trend-following technique that utilizes upper and lower bands and indicators.
This method involves buying when the indicator confirms the strength of the stock price as it approaches the upper band, and selling when the indicator confirms the weakness of the stock price as it approaches the lower band.
Technique III is a reversal technique that utilizes multiple band tags (contacts) and indicators.
A reversal can be predicted when the stock price touches the upper band several times but the indicator shows gradual weakness, or when the stock price touches the lower band several times but the indicator shows gradual strength.
In this book, Bollinger explains the process through which each technique was developed and explains the optimal setup and indicator selection methods to increase the winning rate.
As with most great inventions, Bollinger Bands have the advantage of simplicity.
The three core trading techniques are simple and clear, so anyone can easily understand and use them.
A must-read for all market participants utilizing Bollinger Bands.
This book is filled with unique investment techniques for traders and the author's unique insights as a professional trader with over 30 years of practical experience:
· The first systematic review of the theoretical underpinnings and practical applications of this innovative technical analysis tool.
· How to confirm the W-shaped bottom and M-shaped top pattern and utilize Bollinger Bands
· Strategic use of Bollinger Bands for short-, medium-, and long-term trading
· Three trading techniques with high winning rates, personally used and verified by the author.
· Indicators derived from Bollinger Bands, %b and Bandwidth Analysis
The key to investment analysis is to exclude emotions as much as possible and focus solely on market movements and facts to determine profit potential.
Since the introduction of technical analysis, no technique has guided investors along this path as accurately as Bollinger Bands.
The widespread popularity of Bollinger Bands is a testament to this.
This book provides tips, guidelines, and rules for applying Bollinger Bands to any investment strategy, making it a must-read for traders.
GOODS SPECIFICS
- Publication date: January 26, 2021
- Format: Hardcover book binding method guide
- Page count, weight, size: 352 pages | 740g | 152*225*30mm
- ISBN13: 9791188279807
- ISBN10: 1188279807
You may also like
카테고리
korean


korean

![ELLE 엘르 스페셜 에디션 A형 : 12월 [2025]](http://librairie.coreenne.fr/cdn/shop/files/b8e27a3de6c9538896439686c6b0e8fb.jpg?v=1766436872&width=3840)


