

Volume investment technique
 |
Description
Book Introduction
Amazon's longest-running bestseller! Uncover the secrets of volume investing! Trading volume is the footprint of smart money! The only book that practically reveals the relationship between trading volume and price! Recommended by systrader79, Dayjang (Kim Young-ok), and the friendly Jaeseung! Trade with the institution rather than trying to beat it! The characteristic of the VPA (Volume Price Analysis) trading method, which translates to volume price analysis, is that it follows the powers and institutions, i.e. the so-called smart money, rather than trying to beat them. So how can we follow the smart money and trade accordingly? Above all, how can we identify when powerful forces and institutions are buying and selling? This book addresses these questions. The author speaks from the perspective of a group referred to in the book as insiders, a group known for its smart money. The sole purpose of insiders is to make individuals buy during the distribution phase and sell during the accumulation phase. If we understand their behavioral patterns, we too can sell during the distribution phase and buy during the accumulation phase, just like insiders. Understanding this is the core of this book. The author predicts market direction through various candlestick patterns, such as shooting stars, hammers, long-body candlesticks, and short-body candlesticks, and the corresponding trading volume. Here, the author provides detailed examples of what we should do in the sideways movement created by support and resistance, and what we should look for when a breakout occurs in the sideways movement. Where is the market now in its entire journey? Where will it stop or break out in the future? Or where will it turn and fall? This book will guide you through market entry points, when to maintain a position, and when to exit. This is definitely a must-read for almost every investor. |
- You can preview some of the book's contents.
Preview
index
Before entering
Entering
Chapter 1.
There's nothing new in trading.
Chapter 2.
Trading volume and price movement
Chapter 3.
Stock prices alone cannot tell you what price movements are.
Chapter 4.
Pay attention to price discrepancies
Principle 1.
Art, not science / Principle 2.
Patience / Principle 3.
Everything is relative / Principle 4.
Practice makes perfect / Principle 5.
Technical Analysis / Principle 6.
Verification or anomaly / Example of a verified case / Example of anomaly / Example of multiple candles
Chapter 5.
Follow the insider
Accumulation phase / distribution phase / supply test / demand test / two concepts of insider behavior / selling peak / buying peak
Chapter 6.
Distinguish between low and high volumes.
Shooting star candle: Bearish / Hammer candle: Bullish / Long-legged doji candle: Indecision / Long-body candle: Strong market sentiment / Short-body candle: Weak market sentiment / Hanging candle: Potential weakness after an uptrend / Stopping volume: Bullish / Rising volume: Bearish
Chapter 7.
If the trading volume becomes stronger
Support and Resistance / Top of an Uptrend / Bottom of a Downtrend / Isolated Pivot / House of Support and Resistance
Chapter 8.
Let's forget about previous trends and trend lines.
Chapter 9.
New trends lead to profits
Chapter 10. The A to Z of VPA
Chapter 11.
If you know the pattern, you can see the profit.
Chapter 12.
Innovation is needed now
Equivalent Volume Chart / Candlestick Volume Chart / Delta Volume / Cumulative Delta Volume
Acknowledgements
Detailed image
Into the book
All you have to do now is open your mind and embrace the simple logic and power of this volume price analysis method, which I call VPA volume price analysis for short.
Volume price analysis is a term I coined.
You won't find these terms and definitions anywhere else.
The reason I use this term is because this methodology is described in three simple words.
As a trader, there is only one question I want to be sure of answering every time I trade.
The question is, 'Where will prices go next?'
Volume price analysis provides an answer to this question.
Volume price analysis can be applied to all timeframes and markets, and can be used to trade any investment product.
The key to my success has been verifying and predicting future price action using trading volume.
I hope that after reading this book, you will permanently change your approach to trading. Open your mind to the simple logic of VPA.
Then, immediately after reading this book, you will be able to interpret charts and predict price movements.
--- p.11
It's no surprise that Richard Ney has become a folk hero.
His books still sell today, and their content remains relevant to today's world.
Why? Because everything Richard Ney exposed in his book is still happening in every market.
Let me say this: I am not a conspiracy theorist.
It just conveys the reality of trading.
Every market we enter to trade or invest is manipulated in some way.
Whether the central bank intervenes in the foreign exchange market covertly, regularly, or very openly, the only difference is how market makers in the stock market operate.
There is one thing that insiders cannot hide their activities from: trading volume.
This is why you should read this book: volume reveals the truth behind price movements.
Verify the price.
--- p.32
To understand how experts work, think of them as wholesalers trying to sell their inventory of stocks at retail prices.
If they sold all their inventory off the shelves, they would use the profits to buy more goods at wholesale prices.
I used the above analogy to tell the Uncle Joe story when I contributed to Working Money magazine.
In this quote, wholesalers is my term for insiders, including experts, market makers, institutional investors, and big players.
Their primary goal is to make a profit by buying at wholesale prices and selling at retail prices.
Here's something to remember: As explained in VPA Rule #2, dramatic market changes always take time, due to Wyckoff's Law of Cause and Effect.
Because long-term trends involve corrections and reversals, small fluctuations such as ups and downs are always visible in the market, and it often takes some time for a major change in the trend to occur.
Note that the longer it takes (cause), the greater the change (effect).
Additionally, the period varies depending on the market.
While some markets see changes in just a few days, others take months to see changes.
(We will explore the subtle differences that apply to specific markets later.)
--- p.110
Sideways sections appear in many shapes and sizes and at all times.
Stock indices can trade within narrow ranges for days or even weeks.
Cross currency pairs may trade sideways for several months.
Bonds can trade in very narrow ranges, especially during financial crises, and stocks can remain underwater for months.
Conversely, it may last for several minutes or even hours.
Even then, the basic concept remains the same; as VPA traders, we simply need to remember that cause and effect go hand in hand.
While sideways movement on a 5-minute chart can provide day traders with support and resistance levels and potentially breakout trading opportunities, it is of little use to long-term investors.
However, if there is a deep sideways movement on the daily chart of the same investment product, and if there is a subsequent movement that penetrates the ceiling or floor, it will certainly have significant implications.
This is another reason why you should trade using charts of multiple timeframes.
A sideways movement on a 5-minute chart is less meaningful than a 15-minute chart or a 1-hour chart.
That is, all other things being equal, the longer the time horizon, the greater the significance.
Once again, it's the concept of cause and effect and time.
--- p.196
Based on my 20 years of experience using volume as a dominant indicator, I'd like to share some thoughts, observations, advice, and opinions with you.
As I mentioned earlier, I was lucky enough to learn trading on volume from the beginning.
Thanks to this, I was able to avoid wasting a lot of time and make significant profits over the years.
Many aspiring traders lose confidence and even financial losses after years of trading with ineffective systems and methods.
And most of them give up.
Some of these discover volume by accident.
Some people, like me, immediately embrace this methodology, while others don't. If you're one of the latter, I hope this demonstrates that VPA is a logical and reasonable approach.
If you decide that VPA isn't for you, you haven't lost anything except the few dollars you spent on the book.
--- p.267
Publisher's Review
Amazon's longest-running bestseller!
The only book that practically reveals the secret between volume and price!
Volume and price are the only leading indicators!
All you need to succeed is a chart with volume and price!
There is a word you will naturally hear when investing in stocks.
These are ‘power’ and ‘institution’.
Why are these groups, represented by big investors and pension funds, so important in Korea? Because they manage sums of money incomparable to those of individual investors, their buying and selling activities alone can significantly impact stock prices.
So most investors follow the trail of these and foreigners.
This is why it is so interesting to see how much they bought at the end of each session.
But here a question arises.
Do the stocks they buy inevitably rise? And how can we find their traces?
Anna Cooling, the author of this book, learned trading from a man named Albert Rabos, and the method he taught was to follow the smart money represented by institutions.
The author called this trading method VPA (Volume Price Analysis), and its advantage is that it can predict 'where the price will go next.'
The hint comes from price movement and volume analysis.
Trading volume and price precede any news.
Because that news is also spread by a group classified as smart money.
In other words, if you want to be successful in stock investing, you only need to analyze one thing.
This is a chart with volume and price.
The author frequently cites legendary trader Richard Wyckoff's Law, as it is the most important truth when analyzing charts with volume and price.
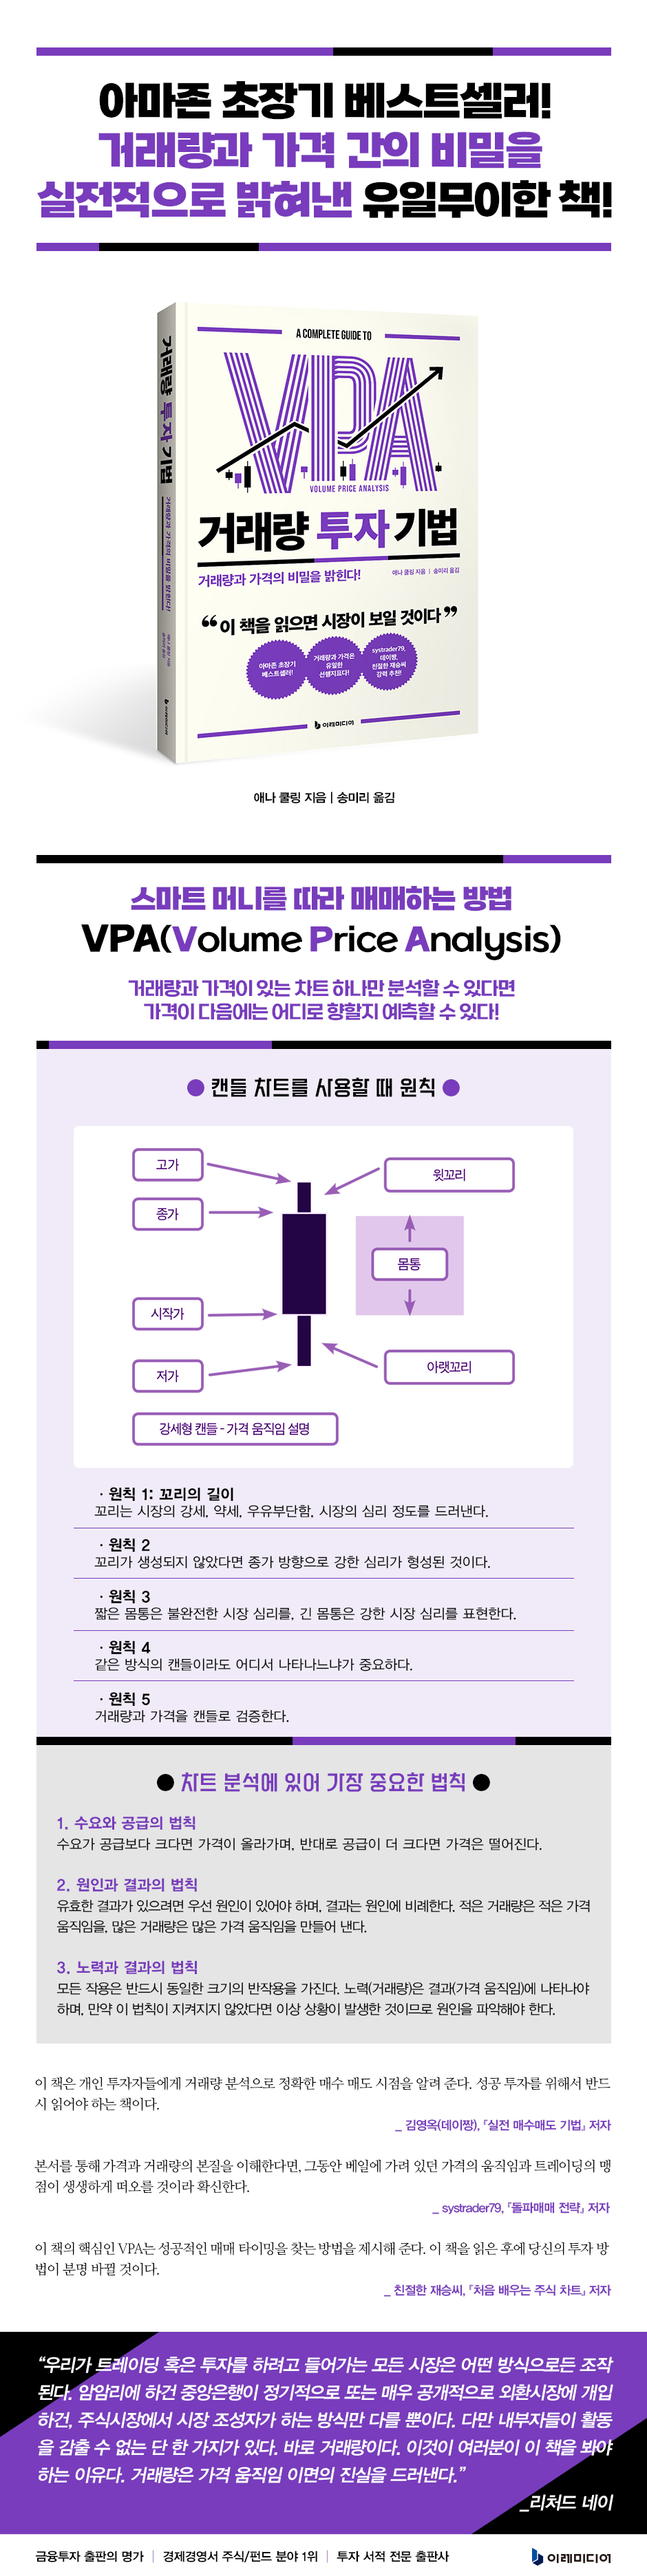
1.
The law of supply and demand
If demand is greater than supply, prices rise; conversely, if supply is greater, prices fall.
2.
The law of cause and effect
For there to be a valid effect, there must first be a cause, and the effect is proportional to the cause.
Low volume creates low price movement, high volume creates high price movement.
3.
The Law of Effort and Results
Every action has an equal and opposite reaction.
Effort (volume) must be reflected in results (price movement), and if this rule is not followed, an abnormal situation has occurred and the cause must be identified.
In other words, if the candlestick bar is long, the trading volume should be high, and if the candlestick bar is short, the trading volume should be low.
If there is a lot of volume but the candlestick is not long, or if the candlestick is long but the volume is low, then something unusual has happened.
So how should we interpret this anomaly?
Should I hold the position or should I get out?
A book that tells you when to buy and sell through volume price analysis!
Behind this phenomenon are insiders, classified as institutions and smart money.
Richard Ney, another great man mentioned frequently in this book, wrote about them:
Every market we enter to trade or invest is manipulated in some way.
Whether the central bank intervenes in the foreign exchange market covertly, regularly, or very openly, the only difference is how market makers in the stock market operate.
But there is one thing that insiders cannot hide their activities.
It's the trading volume.
This is why you should read this book.
Volume reveals the truth behind price movements.
To answer one of the questions above, "Do stocks purchased by institutions always rise?" the answer is "no."
Whether the purchase is for the sake of an increase or to trap individuals called "ants" in the wrong area must be confirmed through price movements and trading volume within the chart.
In other words, you need to be able to distinguish between these two depending on the situation.
This is why you should read this book.
Many people wonder how to fight and win against those who manipulate the market.
However, the author says that rather than fighting them, we should analyze their behavior patterns and trade according to them.
So, unlike many books, the author speaks from the perspective of an insider (a general term for institutions, experts, and market makers).
The sole purpose of insiders is to make individuals buy during the distribution phase and sell during the accumulation phase. If we understand the behavior patterns of insiders, we too can sell during the distribution phase and buy during the accumulation phase.
Understanding this is the core of this book.
As Nay wrote earlier, the only thing insiders cannot hide is trading volume.
This book analyzes candlestick patterns in detail based on trading volume to predict price movements. According to the author, VPA is a theory that has existed for over 100 years, but the author's unique approach to combining candlestick patterns with this theory is truly unique.
The principles for using candlestick charts are as follows:
Rule 1: Tail length
Tails reveal the strength, weakness, indecision, and level of market sentiment.
Principle 2
If no tail is formed, a strong sentiment has formed in the direction of the closing price.
Principle 3
A short body indicates incomplete market sentiment, while a long body indicates strong market sentiment.
Principle 4
Even if it is the same type of candle, where it appears is important.
Principle 5
Verify trading volume and price with candles.
Accordingly, the market direction is predicted through various candle patterns such as shooting star, hammer, long body candle, and short body candle, and the corresponding trading volume.
Here, the author provides detailed examples of what we should do in the sideways movement created by support and resistance, and what we should look for when a breakout occurs in the sideways movement.
Still, you may not understand.
So, the author uses charts to further explain the theory explained in Chapters 10 and 11.
If you've been following along, the charts in Chapters 10 and 11 will clearly show you what we need to look at as investors.
Where is the market now in its entire journey? Where will it stop or break out in the future? Or where will it turn and fall? This book will guide you through market entry points, when to maintain a position, and when to exit.
This is definitely a must-read for almost every investor.
The only book that practically reveals the secret between volume and price!
Volume and price are the only leading indicators!
All you need to succeed is a chart with volume and price!
There is a word you will naturally hear when investing in stocks.
These are ‘power’ and ‘institution’.
Why are these groups, represented by big investors and pension funds, so important in Korea? Because they manage sums of money incomparable to those of individual investors, their buying and selling activities alone can significantly impact stock prices.
So most investors follow the trail of these and foreigners.
This is why it is so interesting to see how much they bought at the end of each session.
But here a question arises.
Do the stocks they buy inevitably rise? And how can we find their traces?
Anna Cooling, the author of this book, learned trading from a man named Albert Rabos, and the method he taught was to follow the smart money represented by institutions.
The author called this trading method VPA (Volume Price Analysis), and its advantage is that it can predict 'where the price will go next.'
The hint comes from price movement and volume analysis.
Trading volume and price precede any news.
Because that news is also spread by a group classified as smart money.
In other words, if you want to be successful in stock investing, you only need to analyze one thing.
This is a chart with volume and price.
The author frequently cites legendary trader Richard Wyckoff's Law, as it is the most important truth when analyzing charts with volume and price.
1.
The law of supply and demand
If demand is greater than supply, prices rise; conversely, if supply is greater, prices fall.
2.
The law of cause and effect
For there to be a valid effect, there must first be a cause, and the effect is proportional to the cause.
Low volume creates low price movement, high volume creates high price movement.
3.
The Law of Effort and Results
Every action has an equal and opposite reaction.
Effort (volume) must be reflected in results (price movement), and if this rule is not followed, an abnormal situation has occurred and the cause must be identified.
In other words, if the candlestick bar is long, the trading volume should be high, and if the candlestick bar is short, the trading volume should be low.
If there is a lot of volume but the candlestick is not long, or if the candlestick is long but the volume is low, then something unusual has happened.
So how should we interpret this anomaly?
Should I hold the position or should I get out?
A book that tells you when to buy and sell through volume price analysis!
Behind this phenomenon are insiders, classified as institutions and smart money.
Richard Ney, another great man mentioned frequently in this book, wrote about them:
Every market we enter to trade or invest is manipulated in some way.
Whether the central bank intervenes in the foreign exchange market covertly, regularly, or very openly, the only difference is how market makers in the stock market operate.
But there is one thing that insiders cannot hide their activities.
It's the trading volume.
This is why you should read this book.
Volume reveals the truth behind price movements.
To answer one of the questions above, "Do stocks purchased by institutions always rise?" the answer is "no."
Whether the purchase is for the sake of an increase or to trap individuals called "ants" in the wrong area must be confirmed through price movements and trading volume within the chart.
In other words, you need to be able to distinguish between these two depending on the situation.
This is why you should read this book.
Many people wonder how to fight and win against those who manipulate the market.
However, the author says that rather than fighting them, we should analyze their behavior patterns and trade according to them.
So, unlike many books, the author speaks from the perspective of an insider (a general term for institutions, experts, and market makers).
The sole purpose of insiders is to make individuals buy during the distribution phase and sell during the accumulation phase. If we understand the behavior patterns of insiders, we too can sell during the distribution phase and buy during the accumulation phase.
Understanding this is the core of this book.
As Nay wrote earlier, the only thing insiders cannot hide is trading volume.
This book analyzes candlestick patterns in detail based on trading volume to predict price movements. According to the author, VPA is a theory that has existed for over 100 years, but the author's unique approach to combining candlestick patterns with this theory is truly unique.
The principles for using candlestick charts are as follows:
Rule 1: Tail length
Tails reveal the strength, weakness, indecision, and level of market sentiment.
Principle 2
If no tail is formed, a strong sentiment has formed in the direction of the closing price.
Principle 3
A short body indicates incomplete market sentiment, while a long body indicates strong market sentiment.
Principle 4
Even if it is the same type of candle, where it appears is important.
Principle 5
Verify trading volume and price with candles.
Accordingly, the market direction is predicted through various candle patterns such as shooting star, hammer, long body candle, and short body candle, and the corresponding trading volume.
Here, the author provides detailed examples of what we should do in the sideways movement created by support and resistance, and what we should look for when a breakout occurs in the sideways movement.
Still, you may not understand.
So, the author uses charts to further explain the theory explained in Chapters 10 and 11.
If you've been following along, the charts in Chapters 10 and 11 will clearly show you what we need to look at as investors.
Where is the market now in its entire journey? Where will it stop or break out in the future? Or where will it turn and fall? This book will guide you through market entry points, when to maintain a position, and when to exit.
This is definitely a must-read for almost every investor.
GOODS SPECIFICS
- Date of issue: September 27, 2024
- Page count, weight, size: 304 pages | 544g | 152*225*19mm
- ISBN13: 9791193394472
- ISBN10: 1193394473
You may also like
카테고리
korean


korean

![GQ KOREA Mark (Monthly): December [2025]](http://librairie.coreenne.fr/cdn/shop/files/8ef265dbbfbf186523ed75ba7319009d.jpg?v=1765340328&width=3840)


