

William O'Neil's Short Selling Technique
 |
Description
Book Introduction
A Complete Guide to Short Selling Investment Techniques!
The author of this book, William O'Neil, who runs an investment advisory firm and provides investment information to hundreds of institutional investors around the world, is considered an authority on Wall Street.
This book compiles decades of his research and provides a comprehensive overview of short selling.
It covers the market conditions suitable for short selling and the surrounding circumstances to consider, as well as how to select stocks, spot signs of a top on the chart, and the optimal timing for short selling.
To make a profit from stock investment, it is important to enter the market at the right time.
William O'Neil conducted several studies to capture the optimal timing and discovered that even when the leading stocks that led the bull market hit the ceiling and fell, the previous bullish sentiment remained and they rebounded several times.
This book explains, with numerous examples, how to distinguish whether such a rebound is temporary or a resurgence.
Additionally, the book contains approximately 150 sample charts, ranging from the year William O'Neil first began short selling to charts as recent as 2004.
It also explains the shape of the pattern, the last high, the stock price movements and volume fluctuations to watch out for, and the positions of moving averages and stock prices, as well as other factors that must be considered when identifying a short selling opportunity.
- You can preview some of the book's contents.
Preview
index
Acknowledgements
preface
PART 1: When and How to Short Sell
What is short selling?
Short selling mechanism
How Market Cycles Occur
Short sell only in appropriate market conditions.
Watch the market and individual stocks together.
Which stocks should you short?
Check your outstanding balance
Use the overall market average
Optimal Short Selling Timing
Read the final high signal
When rebounding after a high, check for sustainability.
Watch for stocks that fail to sustain a rebound.
An example of the 50-day moving average breaking down
Case of a property wall
Case of head and shoulders
Setting a limit order for short selling
When should I redeem?
Stocks that should not be shorted
Don't act like the crowd
Risk always exists
Short Selling Checklist
PART 2: The Anatomy of Short Selling
Short selling in head and shoulders formation
Short selling in an incomplete terminal low pattern
Technical signals that indicate when to short sell
PART 3: Short Selling Trading Model
Cisco Systems
Lucent Technologies
Calpine
yahoo
Broadcom
Sure-Tid Products
Lowe's
Redman Industries and Skyline
Ccube Microsystems
Other optimal short selling examples
Detailed image
Into the book
There are two sides to everything.
The stock market is the exception! There's only one side to the stock market.
It is a suitable aspect, neither an upward aspect nor a downward aspect.
There are very few investors who are truly successful at buying stocks, and even fewer who are successful at selling them.
Virtually no one, including professionals, successfully shorts.
---From "When and How to Short Sell"
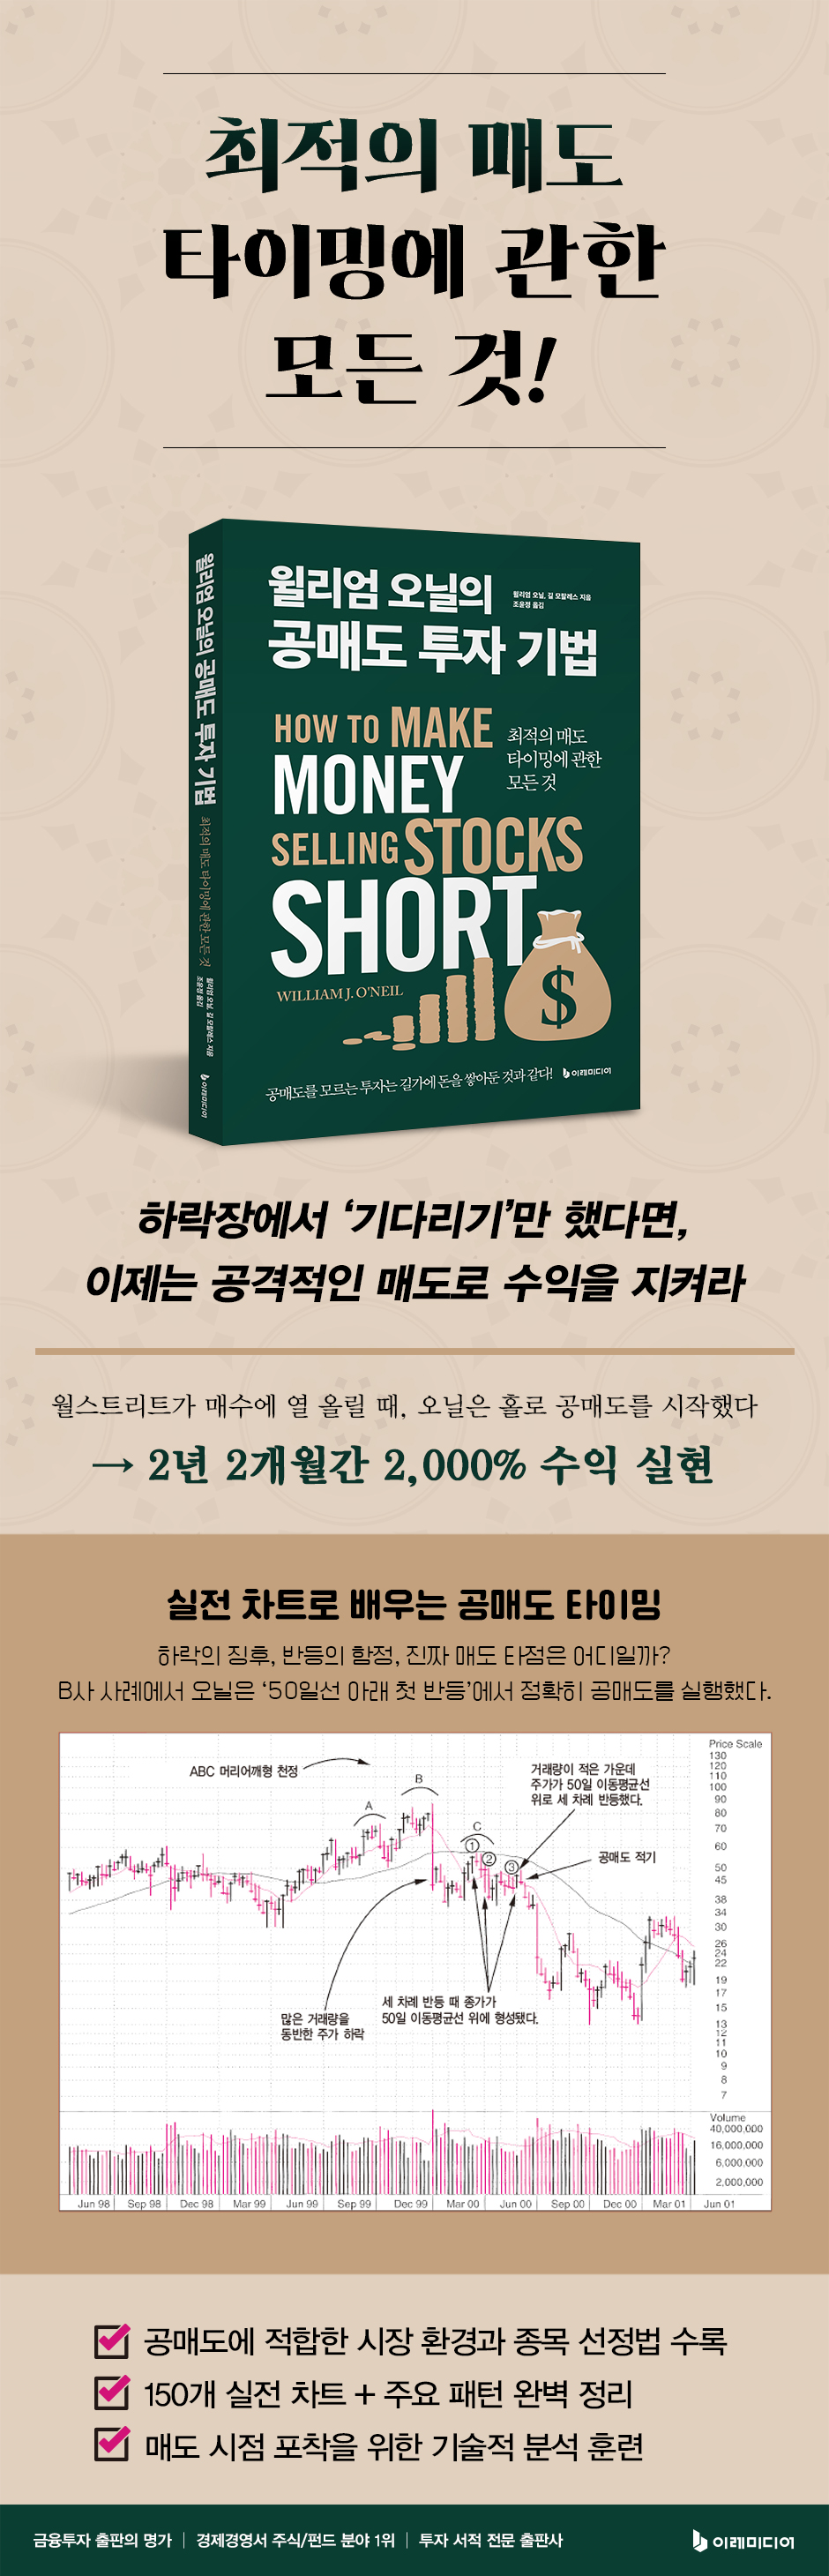
Stock prices that hit the ceiling often fall sharply, falling below their 50-day moving average.
And most of them bounce back above the 50-day moving average two to four times.
This is the time when you need to closely watch stock prices.
Look for moments when the stock price breaks below its 50-day moving average due to a sudden surge in trading volume.
This second drop in stock price confirms a downward trend that started from the initial drop after hitting the ceiling.
Now you need to place a short order as close to the point where the price breaks the 50-day moving average as possible.
---From "The Optimal Short Selling Timing"
A classic pattern that provides short selling opportunities is the 'head and shoulders' pattern.
You may have heard of the head and shoulders shape.
It was given this name because it has a ‘head’ in the middle and ‘shoulders’ on either side.
In a textbook head and shoulders pattern, the right shoulder should be lower than the left shoulder, and the overall volume flow should increase from left to right across the pattern.
But in reality, it doesn't have to be that way.
…
If you watch stock prices closely, you will often find that after an initial drop, there are times when the stock price rises with tremendous momentum amidst heavy trading volume.
This sometimes happens at the end of two or three bounce attempts from the right shoulder of a head and shoulders pattern.
Then, short sellers who miss the timing will inevitably suffer.
Study the charts of stocks that were leaders in the past but then hit a ceiling and then fell sharply.
There are many stocks in the past markets that can serve as models for the present.
What happened in the past will happen again someday.
As you know, the stock market has a history of hundreds of years.
In short selling, timing is more important than any other factor.
Therefore, 80 percent of all efforts should be devoted to identifying the enemy.
The stock market is the exception! There's only one side to the stock market.
It is a suitable aspect, neither an upward aspect nor a downward aspect.
There are very few investors who are truly successful at buying stocks, and even fewer who are successful at selling them.
Virtually no one, including professionals, successfully shorts.
---From "When and How to Short Sell"
Stock prices that hit the ceiling often fall sharply, falling below their 50-day moving average.
And most of them bounce back above the 50-day moving average two to four times.
This is the time when you need to closely watch stock prices.
Look for moments when the stock price breaks below its 50-day moving average due to a sudden surge in trading volume.
This second drop in stock price confirms a downward trend that started from the initial drop after hitting the ceiling.
Now you need to place a short order as close to the point where the price breaks the 50-day moving average as possible.
---From "The Optimal Short Selling Timing"
A classic pattern that provides short selling opportunities is the 'head and shoulders' pattern.
You may have heard of the head and shoulders shape.
It was given this name because it has a ‘head’ in the middle and ‘shoulders’ on either side.
In a textbook head and shoulders pattern, the right shoulder should be lower than the left shoulder, and the overall volume flow should increase from left to right across the pattern.
But in reality, it doesn't have to be that way.
…
If you watch stock prices closely, you will often find that after an initial drop, there are times when the stock price rises with tremendous momentum amidst heavy trading volume.
This sometimes happens at the end of two or three bounce attempts from the right shoulder of a head and shoulders pattern.
Then, short sellers who miss the timing will inevitably suffer.
Study the charts of stocks that were leaders in the past but then hit a ceiling and then fell sharply.
There are many stocks in the past markets that can serve as models for the present.
What happened in the past will happen again someday.
As you know, the stock market has a history of hundreds of years.
In short selling, timing is more important than any other factor.
Therefore, 80 percent of all efforts should be devoted to identifying the enemy.
---From "Case of the Head and Shoulders Type"
Publisher's Review
Investors are warriors who go into battle.
Therefore, you must know your enemy accurately and aim for his heart.
As Wall Street analysts were unanimously recommending buys, William O'Neil began shorting.
At the time, it was a strong bull market where people could make a profit by buying today and selling tomorrow, so no one listened to his advice recommending short selling.
But by the end of 1962, a year that would go down in history as the year of the Great Depression, the winners were clear.
Including this period, William O'Neil achieved a 2,000 percent return on his investments over a period of two years and two months.
Some believe that the Korean stock market has truly turned around in the last quarter of 2008, while others believe that it has yet to hit bottom.
In any case, it is a steep decline from the upward trend that has continued for several years, and the index has fallen to the level of 2005, and even among the so-called blue chip stocks, there are countless stocks that are only half their peak value.
What did investors do during this devastating downturn? Did they simply wait, believing in the company's value, or did they quickly accumulate cash and watch from a distance? However, if investors had been aware of short selling, they would have identified the right time to sell during the bear market and secured their profits. Aggressive investors could have profited through short-selling. Therefore, even if the market continues its downward trend, they won't have to worry.
Is your enemy the buyers or the short sellers?
Short selling is one way to invest in stocks.
According to data from the Korea Exchange (KRX), the short selling rate in the stock market exceeded 7 percent in early September 2008, but fell to the 3 percent range due to short selling regulations. However, short selling transactions are still ongoing and have become a major issue this year.
However, there has been no book dedicated solely to short selling, and even less so, no book that specifically explains how to do it.
William O'Neil, who runs an investment advisory firm and provides investment information to hundreds of institutional investors around the world, is called a guru on Wall Street.
In particular, it is acknowledged that no one can surpass him in short selling techniques.
He synthesized decades of research and published everything he knew about short selling here.
This book will teach you how to select stocks, spot signs of a top on a chart, and the optimal timing for short selling, including market conditions suitable for short selling and surrounding circumstances to consider.
Short selling is a selling technique.
To make a profit from stock investment, entering the market at the right time is a priority.
However, if you fail to detect the market signals and seize the right selling opportunity, your success will only be half-hearted and you may even end up incurring losses.
Short selling begins with the skill of detecting signals from the market that indicate a ceiling.
However, the timing of selling is not always the optimal timing for short selling.
William O'Neill conducted several studies to capture that optimal timing.
As a result, we found that even when the leading stocks that led the upward trend hit the ceiling and fell, the previous bullish sentiment remained and they rebounded several times.
That is why, even after the head and shoulders pattern, known as a classic downward reversal pattern, there are three or four rebounds that break above the neckline or the 50-day moving average.
O'Neill provides numerous examples to help you determine whether a rebound is temporary or a resurgence.
Train the optimal short selling pattern.
This book contains approximately 150 sample charts, ranging from the year William O'Neil first began short selling to charts as recent as 2004.
These charts show the "head and shoulders" and "terminal low pattern," which are optimal patterns for short selling.
Each section includes a description of the pattern's shape, the last high, noteworthy stock price movements and volume fluctuations, and the positions of moving averages and stock prices, highlighting essential elements to consider when identifying a short selling opportunity.
We also provide a schematic diagram that generalizes and explains the commonalities of these 150 charts in an easy-to-understand manner. If you fully understand the meaning of each point in the diagram before looking at the chart, you will become skilled at spotting the right time to sell.
GOODS SPECIFICS
- Date of issue: July 11, 2025
- Page count, weight, size: 240 pages | 554g | 176*248*16mm
- ISBN13: 9791193394700
- ISBN10: 1193394708
You may also like
카테고리
korean


korean

![ELLE 엘르 스페셜 에디션 A형 : 12월 [2025]](http://librairie.coreenne.fr/cdn/shop/files/b8e27a3de6c9538896439686c6b0e8fb.jpg?v=1766436872&width=3840)


