

Healthcare Big Data Analysis and Machine Learning Using R
 |
Description
Book Introduction
"Healthcare Big Data Analysis and Machine Learning Using R" is structured to systematically teach everything from the installation and basic use of R and RStudio to data input and organization, visual exploration, statistical analysis, and machine learning techniques.
- You can preview some of the book's contents.
Preview
index
Chapter 1: Getting Started with R
1.1 Introduction to R and Rstudio
1.2 Installing R
1.3 Installing RStudio
1.4 First Steps in Using RStudio
Chapter 2 R Data Analysis
2.1 Entering and Saving Data
2.2 Combining multiple variables into one using the data.frame() function
2.3 Creating new variables through variable operations
2.4 Creating variables using conditional statements
2.5 Summarizing data numerically
2.6 Extracting Data
2.6.1 Data extraction using row and column extraction conditions of a data frame
2.6.2 Extracting data using the subset() function
2.7 Sorting Data
2.7.1 Sorting Data in R (1): Using Basic Commands
2.7.2 Sorting Data in R (2): Using the dplyr Package
2.8 Exporting and Importing Data
2.8.1 Creating and Importing CSV Files
2.8.2 Creating and Importing Excel Files
2.9 Installing R Packages Using the Dialog Box
Chapter 3: Data Analysis Using R Graphs
3.1 Creating a Bar Graph
3.2 Creating a Histogram
3.3 Creating a Pie Chart
3.4 Creating a Line Graph
3.5 Creating a Boxplot
3.6 Comparing multiple graphs on one screen
Chapter 4: Health Checkup Big Data Analysis
4.1 Preparing Public Health Checkup Data
4.2 Changing variable names
4.3 Creating a new data frame with some variables
4.4 BMI variable creation and obesity classification
4.5 Generating Summary Statistics
4.6 Handling Missing Values
4.6.1 Identifying Missing Values
4.6.2 Deleting all observations with missing values
4.6.3 Replacing missing values with the mean of a variable
4.7 Comparison of means, frequencies, and proportions by group
4.8 Cross-tabulation (1): Reflecting obesity levels by gender and age
4.9 Cross-tabulation (2): Reflecting gender, age, and obesity level
Chapter 5: Big Data Visualization Analysis
5.1 Visualization and Analysis of Health Checkup Information Data Using ggplot2
5.1.1 Bar graph
5.1.2 Histogram
5.1.3 Broken Line Graph
5.1.4 Pie Charts and Donut Charts
5.1.5 Scatterplot
5.1.6 Bubble Chart
5.1.7 Ribbon Chart
5.1.8 Boxplots
5.2 Analysis of waiting time trends by department using heatmaps
5.3 Visualization of Dental Clinic Distribution Using Treemap
Chapter 6: R Data Analysis
6.1 Statistical hypothesis testing
6.2 Paired Samples t-Test
6.3 Independent Samples t-Test
6.4 Chi-square test
6.5 One-way ANOVA
6.6 Correlation Analysis
6.7 Simple Regression Analysis
6.8 Multiple Regression Analysis
6.9 Multiple regression analysis using categorical variables
6.10 Machine Learning Overview and Learning Methods
6.10.1 Differences between Statistical and Machine Learning Techniques
6.10.2 Machine Learning Methods: Supervised Learning, Unsupervised Learning, and Reinforcement Learning
6.11 Machine Learning Algorithm (1): Support Vector Machine
6.12 Machine Learning Algorithm (2): Decision Tree
6.13 Evaluating Model Performance Using ROC Curves and AUC
6.13.1 Performance Evaluation of Support Vector Machine Models
6.13.2 Performance Evaluation of Decision Tree Models
Detailed image
Publisher's Review
In modern society, the ability to extract meaningful information from the vast amounts of big data constantly generated across diverse fields, including healthcare, finance, marketing, and engineering, and to repeatedly make optimal decisions is required.
Many researchers and analysts are using R as a representative statistical analysis and data visualization tool for this purpose.
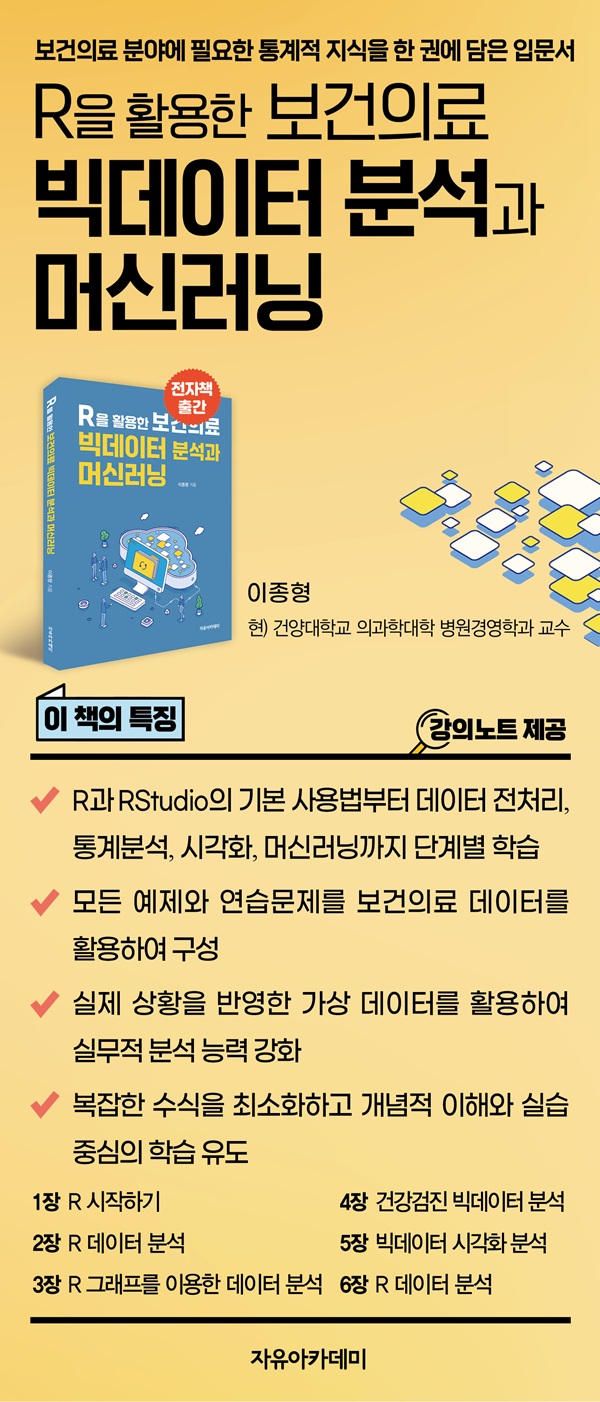
This book is structured to systematically teach you how to install and use R and RStudio, starting with basic usage, and moving on to data entry and organization, visual exploration, statistical analysis, and machine learning techniques.
Chapter 1 explains how to install R and RStudio, how to set up the environment, and how to use them in basic ways.
In Chapter 2, you will learn the basic principles of data analysis using small-scale data, and in Chapter 3, you will learn how to effectively summarize and visualize data through various graphs.
In Chapter 4, we'll learn how to preprocess, summarize, and analyze real-world big data using public health checkup data from 1 million people. Chapter 5 explains how to visualize health checkup data more intuitively and richly using the ggplot2 package.
Finally, Chapter 6 introduces statistical hypothesis testing techniques and machine learning analysis methods, guiding you to effectively acquire healthcare big data analysis and machine learning techniques.
At the end of each chapter in this textbook, we provide practice problems to help you review what you've learned and improve your practical analysis skills.
The data used in the textbook is fictitious data created based on possible real-life situations.
You will be able to overcome practical constraints, such as the complexity of real-world data and privacy protection, and accurately understand and effectively practice various analysis methods.
The data, books, and related information used in the examples in this text can be downloaded or viewed from the Free Academy website's data room (www.freeaca.com).
Finally, I would like to express my gratitude to all the staff at Jayu Academy who worked hard to publish this book, as well as to everyone who has helped me along the way.
Through this book, I hope to lay the foundation for big data analysis and machine learning, and further develop it to develop data-driven problem-solving skills.
Many researchers and analysts are using R as a representative statistical analysis and data visualization tool for this purpose.
This book is structured to systematically teach you how to install and use R and RStudio, starting with basic usage, and moving on to data entry and organization, visual exploration, statistical analysis, and machine learning techniques.
Chapter 1 explains how to install R and RStudio, how to set up the environment, and how to use them in basic ways.
In Chapter 2, you will learn the basic principles of data analysis using small-scale data, and in Chapter 3, you will learn how to effectively summarize and visualize data through various graphs.
In Chapter 4, we'll learn how to preprocess, summarize, and analyze real-world big data using public health checkup data from 1 million people. Chapter 5 explains how to visualize health checkup data more intuitively and richly using the ggplot2 package.
Finally, Chapter 6 introduces statistical hypothesis testing techniques and machine learning analysis methods, guiding you to effectively acquire healthcare big data analysis and machine learning techniques.
At the end of each chapter in this textbook, we provide practice problems to help you review what you've learned and improve your practical analysis skills.
The data used in the textbook is fictitious data created based on possible real-life situations.
You will be able to overcome practical constraints, such as the complexity of real-world data and privacy protection, and accurately understand and effectively practice various analysis methods.
The data, books, and related information used in the examples in this text can be downloaded or viewed from the Free Academy website's data room (www.freeaca.com).
Finally, I would like to express my gratitude to all the staff at Jayu Academy who worked hard to publish this book, as well as to everyone who has helped me along the way.
Through this book, I hope to lay the foundation for big data analysis and machine learning, and further develop it to develop data-driven problem-solving skills.
GOODS SPECIFICS
- Date of issue: August 29, 2025
- Page count, weight, size: 212 pages | 188*257*13mm
- ISBN13: 9791158087500
- ISBN10: 1158087500
You may also like
카테고리
korean


korean

![ELLE 엘르 스페셜 에디션 A형 : 12월 [2025]](http://librairie.coreenne.fr/cdn/shop/files/b8e27a3de6c9538896439686c6b0e8fb.jpg?v=1766436872&width=3840)


