

Ken Fisher's Timeless Chart 90
 |
Description
Book Introduction
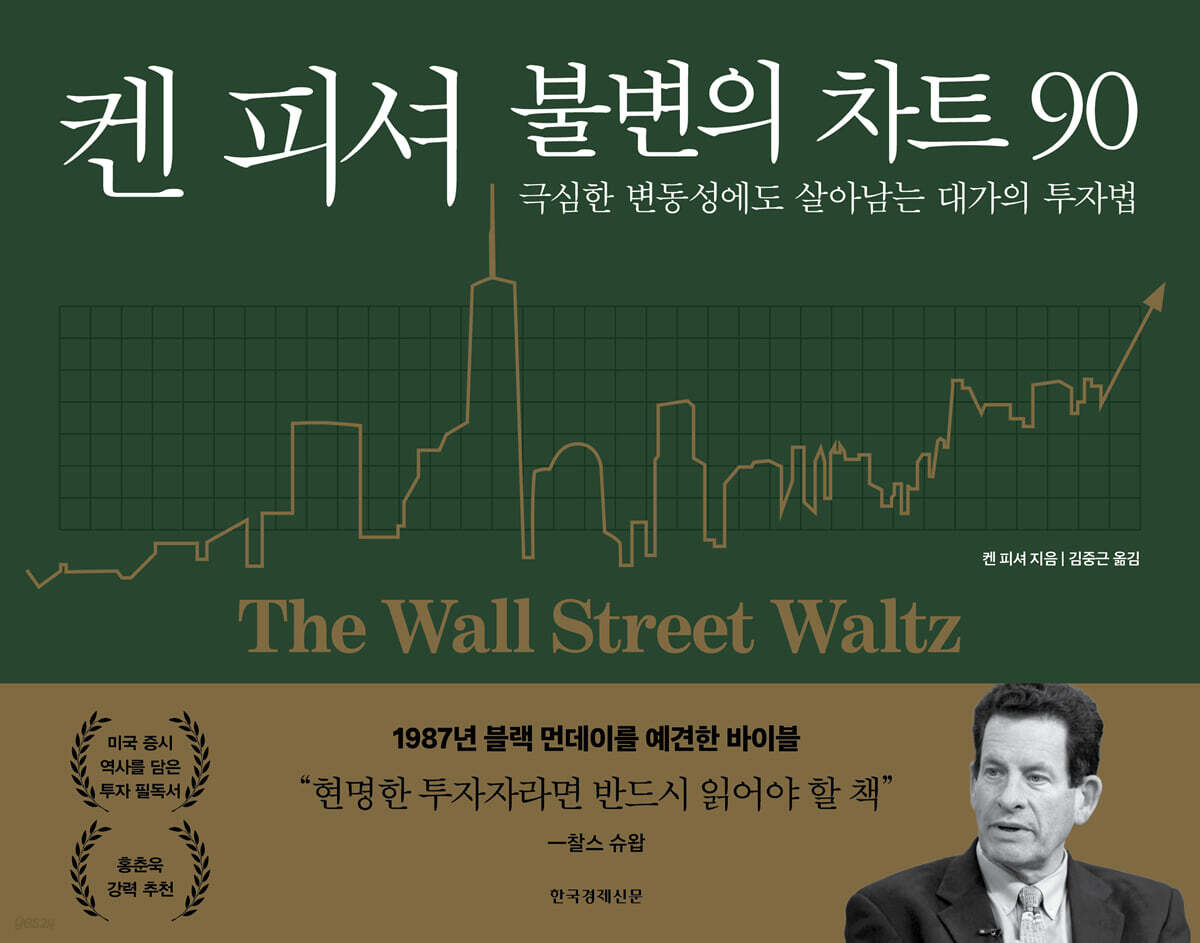
Ken Fisher's only investment guide
The Bible that predicted Black Monday in 1987
A reprint of a famous book that was once sold for hundreds of thousands of won as a used book!
In an age of uncertainty, stock market patterns repeat themselves!
“Thanks to reading this book before, I was able to understand the 2008 financial crisis,
“We were able to navigate times like the 2022 Ukraine war.”
_Hong Chun-wook
Financial markets are always full of unpredictable variables.
Interest rate and exchange rate fluctuations, international disputes, and changes in government policy can instantly shake up the market.
In these times of uncertainty, short-term forecasts and predictions are not very effective.
So, instead of making hasty predictions, wise investors look to the 'past'.
The goal is to find answers to today's investments in the market movements of history.
This book, "Ken Fisher's 90 Timeless Charts," is an attempt to derive investment insights from past trends.
Author Ken Fisher, a world-renowned investment guru, has systematized his investment principles based on decades of market experience and extensive data analysis.
This book is Ken Fisher's only investment guide, meticulously analyzing the cycle of financial crisis and recovery, stock market volatility, and how mass psychology works, all presented in 90 charts.
When the first edition was published, it became a hot topic for accurately predicting Black Monday in 1987, and it was also loved by readers for its in-depth insight into the market.
It has been circulated among numerous investors since going out of print, and this edition includes a Korean-language preface by Ken Fisher.
He says.
"From Yeouido to Wall Street, the essence of the stock market remains the same, past and present." Ultimately, the master reveals in this book that the principles of successful investment remain unchanged, even after a long period of time.
Thus, charts are not simply records of the past, but rather an immutable reference point and compass for investors to make their own judgments in an era of unpredictability.
- You can preview some of the book's contents.
Preview
index
Recommendation
Preface to the Korean edition
Preface to the Revised Edition
Preface to the first edition
Part 1: Stock Market Related Charts
CHART 1. PER's Past and Present
CHART 2.
If you still don't believe me
CHART 3.
The relationship between corporate profits and stock prices
CHART 4.
Comparison of stock and bond yields
CHART 5.
For long-term investments, pay attention to dividend yield.
CHART 6.
Investing with the price-to-book ratio
CHART 7.
Price-to-Cash Flow Ratio: The Hidden Reversal
CHART 8.
How to use the price-to-sales ratio
CHART 9.
Stock Husbands and Bond Wifes: The Real Reason They Can't Break Up
CHART 10.
Don't Be Rash in Predicting the Market: 56 Years of Stock Prices and Short-Term Interest Rates
CHART 11.
Value Line Industrial Index: The Most Appropriate Stock Index to Use
CHART 12.
Investment return ranking
CHART 13.
Overseas diversification investment
CHART 14.
Overseas Stock Markets: Synchronization of the U.S. and Seven Countries' Stock Markets
CHART 15.
51st state of the United States
CHART 16.
Stock prices and GNP
CHART 17.
Growth premium
CHART 18.
The volatility of growth stock prices
CHART 19.
Going public means selling at a high price.
CHART 20.
Investors, wake up!
CHART 21.
M&A strategy considering liquidation value
CHART 22.
A silent crash that no one noticed
CHART 23.
Moving Average Trading Method
CHART 24.
Not all news affects the market.
CHART 25.
Recession and stock prices
CHART 26.
Nine Important Stock Market Cycles
CHART 27.
The volatility of the 1920s returns?
CHART 28. Don't be fooled by the PER.
CHART 29.
Clear warning signs
CHART 30.
Hunters don't just buy cheap stocks.
CHART 31.
You should not buy preferred stocks first.
CHART 32.
2% rule
CHART 33.
Remember what the rich forget
CHART 34.
Monthly Railroad Industry Index (1843–1862)
CHART 35.
The stock price fluctuations of the 18th century can be seen by looking at bank stocks!
CHART 36.
Namhae Shipping Company Bubble Chart
CHART 37.
190 Years of Stock Market Trends
CHART 38.
Did they really make a profit?
CHART 39.
Two Ways to Become a Millionaire
Part 2: Charts on Interest Rates, Commodity Prices, Real Estate, and Inflation
CHART 40.
Interest rate fluctuations
CHART 41.
Comparison of long-term interest rates in four countries
CHART 42.
There is a strong bond between them.
CHART 43.
Snake: Accompanying Fluctuations
CHART 44.
Why do oil prices and interest rates move together?
CHART 45.
High interest rates are a recurring nightmare.
CHART 46.
Lessons from 125 Years of Pension Bonds
CHART 47.
Why Britain Overcame the Economic Crisis
CHART 48.
High interest rates become low interest rates, low interest rates become high interest rates
CHART 49.
Comparison of wholesale prices in the US and UK
CHART 50.
Prices in southern England
CHART 51.
wholesale price inflation
CHART 52.
History of inflation in the United States
CHART 53.
Gold: A Litmus Test for Commodity Prices
CHART 54.
Prices in three countries
CHART 55.
Lessons for preventing war
CHART 56.
Is it only a matter of going up now?
CHART 57.
Is it actually a loss to hold gold for a long period of time?
CHART 58.
Long-term cycle of real estate prices
CHART 59.
The Truth About Rural Land Prices
CHART 60.
There has never been anything like that before
CHART 61.
US house prices
Part 3: Analysis of the Business Cycle and Fiscal Policy, and Misconceptions
CHART 62.
1-minute cheat sheet
CHART 63.
What do you see in the pattern?
CHART 64.
Unemployment Rate and the 1% Rule
CHART 65.
Cars crash too!
CHART 66.
A Twisted Look at the Housing Construction Index
CHART 67.
UK unemployment rate
CHART 68.
Misconceptions about facility investment
CHART 69.
How important are South Africa's gold mines?
CHART 70.
Are labor costs really that high?
CHART 71.
The relationship between electricity consumption and economic growth
CHART 72.
Oil Supply: The Real Consequences of Government Intervention
CHART 73.
Texans aren't the first to hit the learning curve.
CHART 74.
Is it stubbornness or new knowledge?
CHART 75.
Taxes, the entrance fee to the path of development
CHART 76.
Increasing the size of government with a long-term perspective
CHART 77.
steadily increasing local taxes
CHART 78.
The state government rebels
CHART 79.
There is not a single number on the graph.
CHART 80.
Myths About Federal Taxes
CHART 81.
The empty boast of creating a balanced budget
CHART 82.
The Federal Government's Real Estate Investments in "Land Rich"
CHART 83.
US defense spending relative to GNP
CHART 84.
The business cycle that economists don't recognize
CHART 85.
sunspots
CHART 86.
The stock market and skirt length
CHART 87.
Never buy an animal that eats its food!
CHART 88.
The Witch of Wall Street
CHART 89.
The coincidence of natural phenomena and financial markets
CHART 90.
Leather should not be lost in the market
Appendix A.
False myths that scare even children
Appendix B.
Update Chart
CHART 18.
Supply and demand, the true driving force behind prices
CHART 74.
Debt, the Federal Government, and Drug Addiction
CHART 83.
Compare properly
CHART 84.
I knew communism would collapse.
Detailed image
Into the book
The global financial crisis, high-frequency trading, the economic shutdown during the COVID-19 pandemic, the highest inflation since the 1980s, the Trump-initiated tariff war, the cryptocurrency craze, bogus NFTs, algorithmic investing, the AI mania, and even martial law and an impeached president in South Korea—the past two decades since the publication of the revised edition of Ken Fisher's Timeless Chart 90 (2008) have been a series of astonishing events in the financial markets.
Many people today call this the 'New Normal'.
According to experts from all walks of life, each and every one of these things is clear evidence that we are living in 'unprecedented times'.
But the essence of the stock market remains the same, from Yeouido in Korea to Wall Street in the United States.
It hasn't changed.
---From the "Korean Edition Preface"
Investors compare returns between stocks and bonds, so a high PER is acceptable when long-term bond yields (i.e., long-term interest rates) are consistently low.
I was absolutely right when I said at the end of my commentary on this chart that the high P/E ratio in 1987 was a “strong warning sign.”
Because long-term interest rates continued to rise throughout 1987, which ultimately led to Black Monday in 1987 and a sharp stock market crash.
In any case, it is not a good idea to compare the PER with long-term interest rates or to consider investor reactions related to the overall market valuation.
---From "CHART 1. PER's Past and Present"
Taking into account the difference between the bid and ask prices, and adjusting for the exceptional results of the four major bull markets (1932–1935, 1942–1945, 1974–1976, and 2003–2004), which saw large jumps from the bottom of bear markets, large-cap stocks appear to have outperformed small-cap stocks on average.
Over the past 20 years, I've found that regardless of industry, small-cap or large-cap stocks have roughly similar long-term returns.
However, if you still believe that the type of stock, whether small or large, is more important than the overall market trend, you will soon learn a bitter lesson.
---「CHART 12.
Among the “investment return rankings”
Even a massive terrorist attack couldn't completely shake the stock market.
After the terrorist attacks of September 11, 2001, stock prices fell sharply.
However, it recovered to its previous level after 19 trading days, and the strong upward trend continued until the end of the year.
And the terrorist attacks that followed had no significant impact on the stock market.
When the 2004 train bombings in Madrid occurred, the U.S. stock market recovered to its previous levels in just five trading days.
Even on the day of the 2005 London subway bombings, US stock prices actually rose.
What fundamentally moves the stock market is not the news we see now.
---「CHART 24.
“Not all news affects the market”
There is a way to become a millionaire.
However, it is not a way to become rich in a short period of time.
If you harness the power of compounding, virtually anyone can become a millionaire by retirement.
All you need to do is save consistently and invest wisely.
This chart shows how to make a million dollars.
One way is to invest money all at once, and the other is to save money regularly.
The first method assumes that you, a 30-year-old, have saved $10,000 in a tax-free retirement account (IRA).
If you earn a 15% return each year thereafter (which may seem high, but it's not impossible), by the time you turn 65, that money will have grown to $1.3 million.
Amazing? That's the power of compound interest.
---「CHART 39.
From "Two Ways to Become a Millionaire"
It is important to note that at the time, most people believed that if the government repaid its debts, the country would soon reach economic utopia, but this was not the case.
Ironically, while paying off government debt, the United States faced the worst financial crisis and recession in four of its history.
The depression began with the stock market crash of 1837.
At that time, land speculators and the majority of the people lost most of their wealth, and the economic depression continued until 1843.
The federal government's debt repayment policy was not as good as many people imagined.
---「CHART 76.
From “Increasing the size of government from a long-term perspective”
From “Increasing the size of government from a long-term perspective”
Publisher's Review
The very book that has been circulating among investors around the world
Highly recommended by Charles Schwab, David Dreman, and Hong Chun-wook!
Ken Fisher is the son of Philip Fisher, whom Warren Buffett called the "father of growth stock investment philosophy," and is an asset management expert who has built a long-standing reputation in the U.S. market with his own unique investment strategy.
This book, "Ken Fisher's 90 Timeless Charts," is a unique work that visualizes financial data and market trends that he personally analyzed in 90 charts. It holds a unique position among his works in that it is designed to help readers understand the market structure at a glance.
Ken Fisher identifies recurring, structural patterns in financial data, providing benchmarks for reading market rhythms and warning signals.
For example, a market rebound begins when the unemployment rate rises 1% from its low, and signs of overheating appear when the number of new housing units built exceeds 2 million per year.
These specific figures were not clear at the time, but looking back on them later, they served as clear warnings.
This book aims to establish a standard for market insight through recurring structures and data, rather than short-term predictions.
Each chart goes beyond simple statistics to show how policy changes, investor sentiment, and market trends are reflected in the numbers.
Especially in times like today, when interest rates, employment, and geopolitical issues are intertwined and making it difficult to interpret the market, this book provides a framework for comparing and interpreting past figures with the current situation.
Hong Chun-wook, the CEO who wrote the book's recommendation, said, "Thanks to reading this book before, I was able to navigate periods like the 2008 financial crisis and the 2022 Ukraine War." "Ken Fisher's Timeless Chart 90" is a must-read for investors who, in today's market with conflicting outlooks, rely on data over words and memorize structural patterns rather than rely on intuition.
The market is shaking, but
There is a repeating pattern in it
Find investment answers in the past
This book is organized into three parts, and the content covered in each part is clear.
First, in Part 1, we analyze and visualize how the stock market moves from various perspectives.
It helps you understand the essential characteristics of stocks and their internal order through charts that visualize the relationship between corporate performance and stock prices, investor sentiment, and long-term market trends.
The following part 2 covers key indicators that affect the overall market, such as interest rates, inflation, raw materials, and real estate prices.
Rather than looking at individual indicators in isolation, this book explains how indicators impact the market over time.
As a result, readers develop the ability to interpret current figures by connecting them to the past.
The final third part examines how various economic activities and policies visible outside the market interlock with the market.
It also includes interesting data on government fiscal policy, the business cycle, and other perspectives that require a different perspective than conventional wisdom.
It also broadens our perspective on investment by identifying misconceptions we have about the market one by one.
Another advantage of this book is that each chart is organized independently, allowing you to select the one you need at any time.
You don't have to read the books in order, and it doesn't take a long time.
The important thing is not to simply look at the chart, but to develop an eye for reading the message contained within it.
From Yeouido to Wall Street
“The essence of the stock market is the same.”
_Ken Fisher
The market is always changing.
Today's confidence in investing becomes tomorrow's uncertainty.
Stock prices rise and fall, news comes and goes.
In this constantly changing trend, investors are likely to be shaken.
Every time, we are faced with the question, “What should I believe and judge?”
This book is also an answer to that question.
It refers to the principles and structure of human psychology that the market has repeatedly demonstrated, revealed through hundreds of years of data.
This book, based on Ken Fisher's extensive data and insights, presents 90 charts that reveal the unchanging core underlying market movements.
Ken Fisher says in the preface to the Korean edition:
“From Yeouido to Wall Street, the essence of the stock market is the same now as it was then.”
Moreover, no matter how much time passes, “the greatest and most profound truth this book seeks to convey has not changed a single bit.” As he said, the market may appear in different forms, but its principles remain the same.
This book contains that principle, and we are at a point where we need to reread it.
GOODS SPECIFICS
- Date of issue: May 26, 2025
- Page count, weight, size: 348 pages | 976g | 250*195*25mm
- ISBN13: 9788947501637
- ISBN10: 8947501638
You may also like
카테고리
korean


korean

![ELLE 엘르 스페셜 에디션 A형 : 12월 [2025]](http://librairie.coreenne.fr/cdn/shop/files/b8e27a3de6c9538896439686c6b0e8fb.jpg?v=1766436872&width=3840)


