

Exploring Earth Science Data Analysis & Visualization with Python
 |
Description
Book Introduction
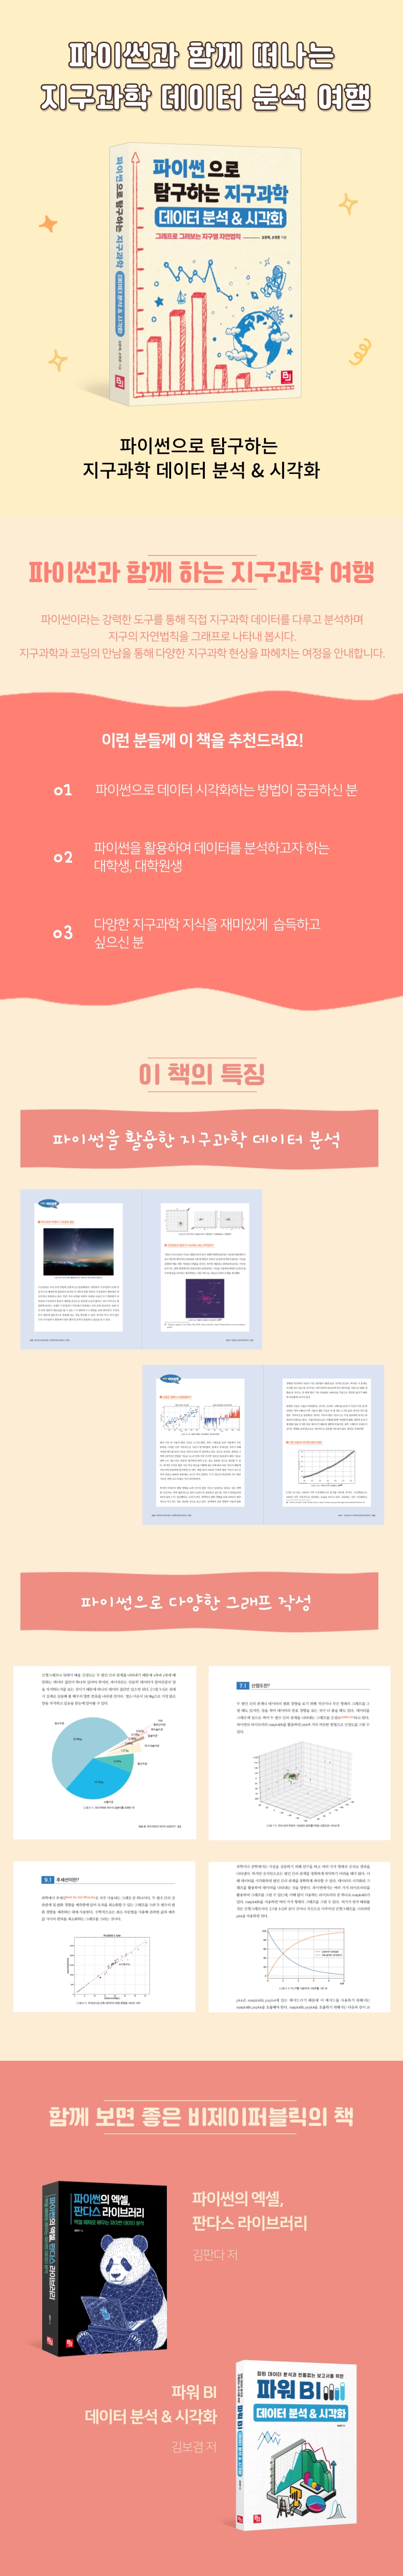
Python Meets Earth Science
A systematic structure that anyone can easily follow
This book does not simply convey theoretical earth science knowledge.
We utilize Python, a powerful tool for data analysis, to directly manipulate and visualize data and help you gain a deeper understanding of earth science phenomena.
Python is a programming language that is accessible even to beginners and provides various libraries necessary for analyzing geoscience data.
This book will help you use Python to explore data from a variety of fields, including astronomy, meteorology, oceanography, and geology, and to visually represent data from the Earth.
It starts with basic grammar so that even Python beginners can follow along without difficulty, and then data analysis and visualization are organized step by step.
Each code example is provided with detailed explanations so that even beginners can easily understand it.
- You can preview some of the book's contents.
Preview
index
PART 1.
Getting Started with Python for Beginners
_CH 1.
Installing and Running Python
__1-1.
Installing Python
__1-2.
Running Python
_CH 2.
A sneak peek into Python
__2-1.
Simple arithmetic operations
__2-2.
String slicing and arithmetic operations
__2-3.
Various ways to specify variables
__2-4.
Convert letters to numbers
__2-5.
Extracting only specific data from a list data type
__2-6.
Using methods
__2-7.
# Comment with
PART 2. Drawing a Line Graph with PLOT
_CH 3. How to draw a linear graph with PLOT
__3-1.
Draw a linear graph
_CH 4. Natural Laws of the Earth as Plotted
__4-1.
Graphing the Mohs hardness of a mineral
__4-2.
Analyze the changing trends of tides by graphing the tide forecast.
__4-3.
Learn about changes in water temperature depending on sea depth.
PART 3.
Representing data with pie charts
_CH 5. How to draw a pie chart using PIE
__5-1.
What is a pie chart?
__5-2.
Drawing a pie chart
_CH 6. Natural Laws of the Earth Drawn with PIE
__6-1.
Creating a Geologic Timeline
__6-2.
Components of the Earth and the Universe
__6-3.
What is dissolved in seawater and freshwater?
PART 4.
Analyzing data with scatter plots
_CH 7. How to draw a scatter plot with SCATTER
__7-1.
What is a scatter plot?
__7-2.
Draw a scatter plot
_CH 8. Natural Laws of the Earth as Drawn with SCATTER
__8-1.
Learn Kepler's Third Law using the physical properties of the planets in our solar system.
__8-2.
Changes in wind direction that occur when a typhoon passes
__8-3.
Learn about star characteristics using HR diagrams
__8-4.
Understanding the characteristics of the seawater around the Korean Peninsula using a temperature-salinity diagram (TS Diagram)
__8-5.
How did we know that the Sun is not at the center of the galaxy?
PART 5.
Smart Data Analysis with Trendlines
_CH 9.
How to draw trend lines
__9-1.
What is a trend line?
__9-2.
Draw a trend line
_CH 10.
Natural Laws of the Earth as Drawn by Trend Lines
__10-1.
Learn about temperature changes in your area
__10-2.
Hubble's law
PART 6.
Draw fun graphs with isoline lines and color maps
_CH 11.
How to draw isoline
__11-1.
What is an isoline?
__11-2.
Drawing isoline
_CH 12.
Make your data more visually appealing with color maps
__12-1.
Representing a color map
_CH 13.
Earth's Natural Laws Illustrated with Isolines and Color Maps
__13-1.
Vertical cross section of seawater temperature
__13-2.
Is there really nothing in the dark nebula?
__13-3.
Centaurus A galaxy appears differently depending on the wavelength
Detailed image
Publisher's Review
From space to the sea,
Earth Science Stories Explained with Python
Let's explore the secrets of our planet by directly handling and analyzing geoscience data using the powerful tool called Python.
We'll take you on an exciting journey to uncover various earth science phenomena through the intersection of earth science and coding.
Let's use Python to graph the natural laws of the Earth.
We've carefully covered the basic knowledge needed to draw graphs so that even beginners can follow along.
Let's draw a variety of graphs, from basic graphs like line graphs and pie charts to scatter plots, trend lines, and isoline graphs.
You can understand the characteristics of each graph and learn how to visualize given data in an appropriate graph.
Features of this book
- Analyze research data in astronomy, meteorology, oceanography, and geology using Python.
- You can naturally learn how to draw graphs in Python while visualizing earth science phenomena.
- We explain the basic grammar step by step so that even Python beginners can understand it.
Readers who need this book
- Anyone curious about how to visualize data with Python
- Those who want to acquire various earth science knowledge in a fun way
- Middle and high school students studying earth science
- College and graduate students who want to analyze data using Python
GOODS SPECIFICS
- Date of issue: December 11, 2024
- Page count, weight, size: 416 pages | 173*230*30mm
- ISBN13: 9791165923044
- ISBN10: 1165923041
You may also like
카테고리
korean


korean

![ELLE 엘르 스페셜 에디션 A형 : 12월 [2025]](http://librairie.coreenne.fr/cdn/shop/files/b8e27a3de6c9538896439686c6b0e8fb.jpg?v=1766436872&width=3840)


