

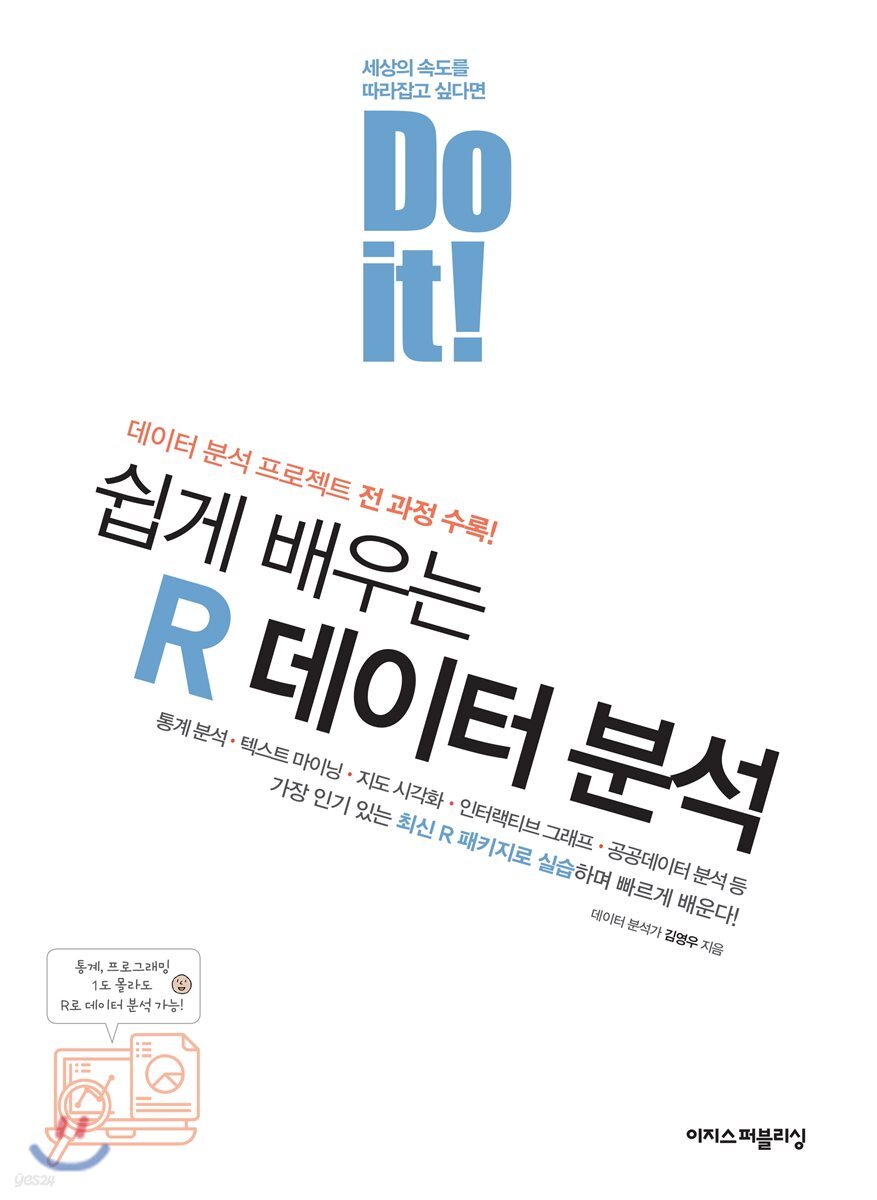
Do it! Learn R data analysis easily.
 |
Description
Book Introduction
You can handle data on your own even if you don't know anything about statistics or programming!
Includes the entire data analysis project process!
A lecture that allows even beginners who are just starting out with data analysis to handle data on their own has been published as a book.
Even if you know nothing about statistics, programming, or data analysis, you can learn the data analysis techniques that are gaining attention recently using R in a fun way through "Do it! Learn R Data Analysis Easily."
This book allows you to experience the entire process of conducting data analysis projects in the field, from data cleansing, processing, and analysis to graph drawing.
- You can preview some of the book's contents.
Preview
index
First, get to know R
01 Hello, R?
01-1 What is R? - Understanding R
01-2 Why R is powerful
02 Creating an R Data Analysis Environment
02-1 Installing R and R Studio
02-2 Getting Familiar with R Studio
02-3 Creating a Project
02-4 Useful Environment Settings
03 Get an extension for data analysis
03-1 Understanding Variables, Changing Numbers
03-2 Understanding the Magic Box of Functions
03-3 Understanding Function Bundles, 'Packages'
Second Yard: Real Practice! Playing with Data
04 Enter the world of data frames!
04-1 What does data look like? - Understanding data frames
04-2 Creating a Data Frame - Let's create test score data!
04-3 Using External Data - Let's load accumulated test score data!
[Organize]
05 Data Analysis Fundamentals! - Understanding Data and Editing It for Easy Handling
05-1 Understanding the Data
05-2 Changing variable names
05-3 Creating Derived Variables
[Organize]
[Analysis Challenge!]
06 Freely Process Data
06-1 Data Preprocessing - Processing Data into Desired Format
06-2 Extract only data that meets the conditions
06-3 Extracting only necessary variables
06-4 Sort in order
06-5 Adding Derived Variables
06-6 Summary by group
06-7 Merging Data
[Organize]
[Analysis Challenge!]
07 Data Cleaning - Removing Missing and Unusual Data
07-1 Find Missing Data! - Refining Missing Data
07-2 Finding Outliers! - Outlier Removal
[Organize]
08 Creating a Graph
08-1 A look at graphs you can create with R
08-2 Scatterplot - Expressing Relationships Between Variables
08-3 Bar Graph - Expressing Differences Between Groups
08-4 Line Graph - Representing Data That Changes Over Time
08-5 Boxplots - Showing Differences in Distribution Between Groups
[Organize]
[Tip 01] Mistakes beginners often make
[Tip 02] Understanding Error Messages
Third Yard: Practical Data Analysis Project
09 Data Analysis Project - "Understanding Korean Life!"
09-1 Preparing to Analyze the 'Korea Welfare Panel Data'
09-2 Salary Differences by Gender - “Do salaries differ by gender?”
09-3 Relationship between Age and Salary - “At what age will I receive the highest salary?”
09-4 Salary Differences by Age Group - “Which Age Group Earns the Highest Salary?”
09-5 Age and Gender Salary Differences - “Do gender salary differences vary by age group?”
09-6 Salary Differences by Occupation - “Which Occupation Pays the Most?”
09-7 Occupation Frequency by Gender - “What occupation is most prevalent by gender?”
09-8 Divorce Rates by Religion - "Do Religious People Divorce Less?"
09-9 Regional Age Ratio - “Where are the regions with the largest number of older people?”
Fourth Yard: The World of Diverse Data Analysis with R
10 Text Mining
10-1 Hip-Hop Lyrics Text Mining
10-2 National Intelligence Service Tweet Text Mining
11 Map Visualization
11-1 Creating a Map of Violent Crime Rates by State in the US
11-2 Creating a stage-by-stage breakdown of population and number of tuberculosis patients by province in South Korea
12 Interactive Graphs
12-1 Creating Interactive Graphs with the Plotly Package
12-2 Creating Interactive Time Series Graphs with the dygraphs Package
13 Hypothesis testing using statistical analysis techniques
13-1 What is statistical hypothesis testing?
13-2 t test - comparing the means of two groups
13-3 Correlation Analysis - Analyzing the Relationship Between Two Variables
14 Creating Data Analysis Reports with R Markdown
14-1 Creating Reliable Data Analysis Reports
14-2 Creating an R Markdown Document
15 R built-in functions, variable types, and data structures
15-1 Extracting Data with R Built-in Functions
15-2 Variable Type
15-3 Data Structure
[Organize]
16 How to Learn Data Analysis Skills Effectively
15-1 Deciding on a Focus
15-2 How to effectively learn data analysis skills
15-3 Fitting in with the Open Source Ecosystem
Correct answer
Search
Detailed image
Into the book
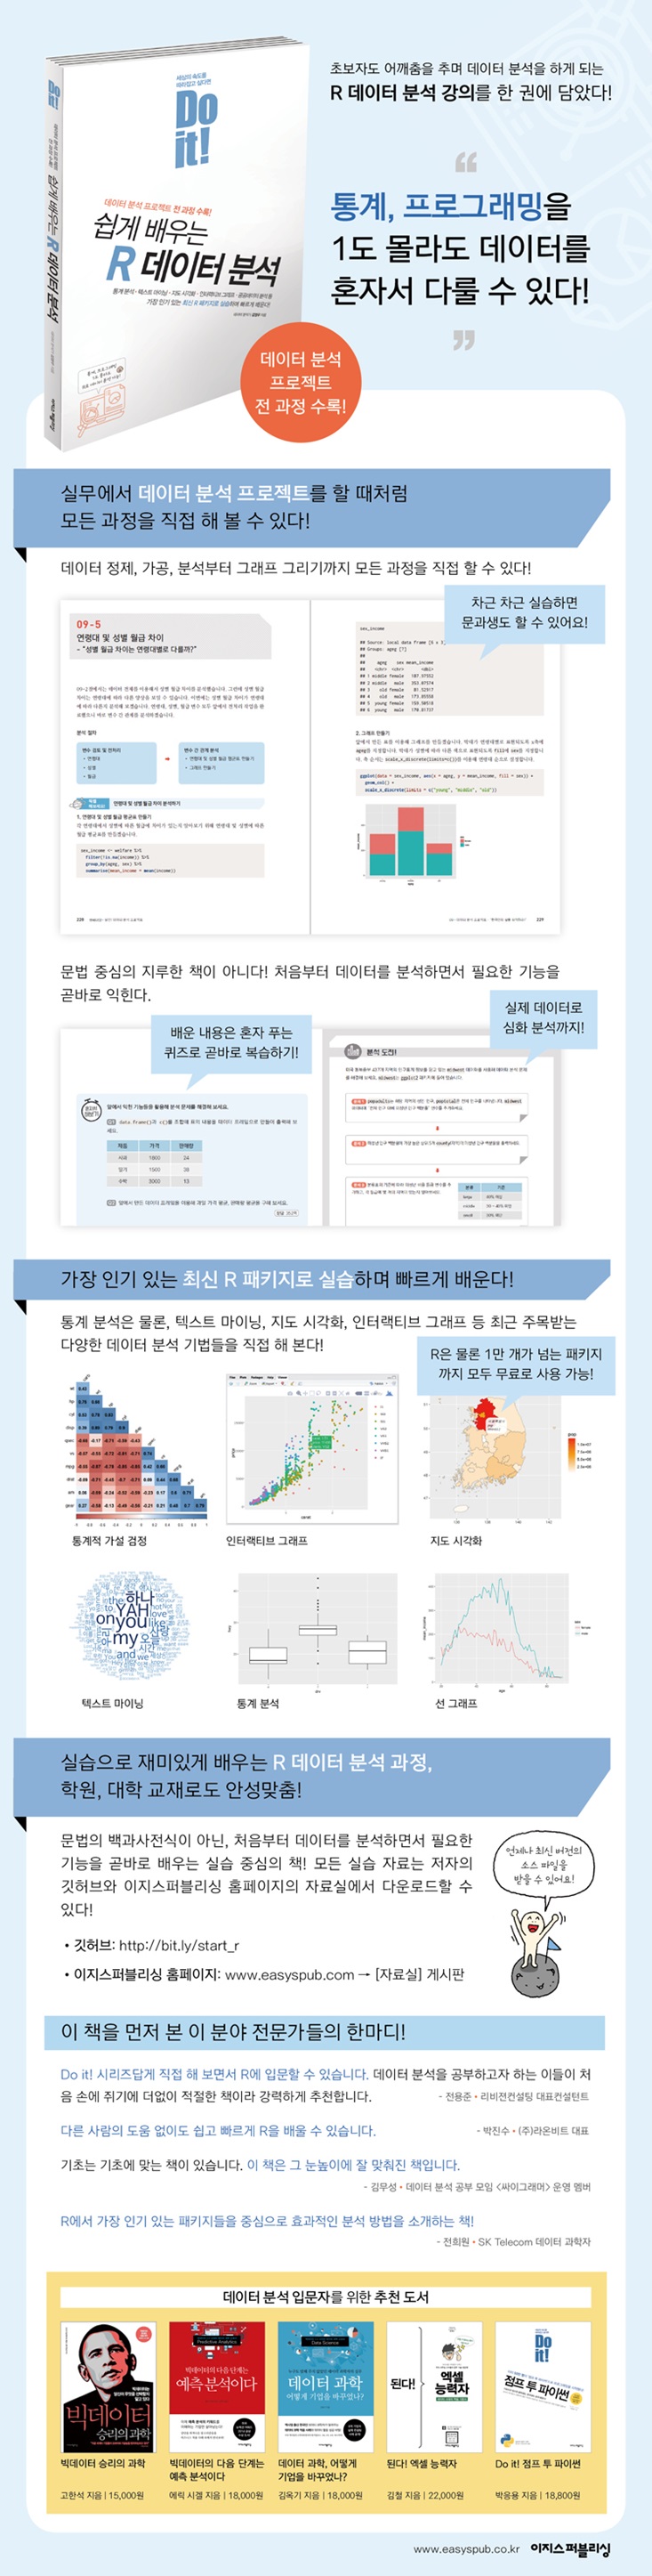
As befitting the Do it! series, it allows you to get started with R through hands-on learning.
R is a great data analysis language that offers a wide range of functionality, from simple to sophisticated and complex.
Although R is already used by many people, it is true that there are some issues that make it difficult for beginners to adapt.
Beginners often worry about where to start studying and how much they should know.
Existing introductory R books, even if they have good content, often run into the problem of being thick because they try to cover a lot of content without leaving anything out.
"Do it! Learn R Data Analysis Easily" showcases the strengths of the Do it! series, which helps beginners overcome the challenges they face.
Rather than teaching everything in a forced manner, this book focuses on helping readers understand the most frequently used key concepts by practicing them themselves.
The author's efforts to explain the book naturally and smoothly using interesting data analysis examples are evident.
I highly recommend this book as it is the perfect first book for anyone who wants to study data analysis.
- Jeon Yong-jun (CEO Consultant, Revision Consulting)
Learn R quickly and easily without any help from others.
After receiving the manuscript for "Do it! Learn R Data Analysis Easily" by Kim Young-woo, I slowly read an R book from cover to cover for the first time in a long time.
This book is written so that anyone, even those who don't major in IT or know nothing about data analysis, can easily read and follow it, and it is written so that even beginners and intermediate users can use it.
Even parts that I would have skipped over if I were writing a book are explained in a friendly and easy-to-understand manner, and the exercises are structured so that you can naturally understand the data analysis process by following them from beginning to end.
In particular, this book organizes and explains the big and small problems the author actually encountered while using R, as well as the problems that anyone who is new to R will experience at least once, so you can learn R easily and quickly without help from others.
It also explains real-world data analysis cases, making it an attractive book for readers who want to learn more in-depth analysis.
If you're new to programming and R, and you have to choose a book to keep by your side, I'd recommend this one without hesitation.
Starting with this book, I look forward to Kim Young-woo's continued publication of R books for intermediate, advanced, and expert users.
- Jin-su Park (CEO of Laonbit Co., Ltd.)
If you're new to R, start with this book!
In this era of data, where data has become so important that it can be called the "age of data," R has grown into a representative tool for data analysis and is enjoying great popularity.
When I started studying R with author Kim Young-woo a few years ago, there weren't many R-related books in Korea.
Although there are many introductory books available now, R still presents a high barrier to entry for beginners.
"Do it! Learn R Data Analysis Easily" is a great book for beginners unfamiliar with statistics and programming, as it guides you step-by-step from installation.
It is particularly valuable as a basic book for social science majors, researchers, and practitioners.
While reading this book, I could feel Kim Young-woo's meticulousness and practical arrangement as the introduction, examples, and applications of functions unfolded in an appropriate flow.
There are books that are suitable for the basics.
This book is well suited to that level.
I believe that many people will be able to take a smooth first step into the world of data analysis through this book.
- Kim Moo-seong (operating member of the data analysis study group [Cygrammer])
Focusing on the most popular packages in R
A book that introduces effective analysis methods!
R is recognized as a very important tool in analytical practice.
It is superior to any other tool, especially in statistical processing and visualization.
Recently, a package has been released that allows you to utilize Python libraries in R, allowing you to freely use the famous TensorFlow in Python.
To use R effectively, it is important to have statistical knowledge as well as to utilize R's various packages appropriately and at the right time.
The author focuses on this area and introduces effective analysis methods centered on the latest and most popular packages.
In addition, it introduces solutions to problems that may arise when using various packages or functions, so that beginners can learn R without any inconvenience.
What I think is both a strength and a weakness of this book is that the explanations are too friendly.
Of course, from the perspective of an experienced person like me, this is a disadvantage, and if the reader starts to see the advantage of being too friendly as a disadvantage as they practice with the book, you can consider that the book has helped you jump to an intermediate level of R or higher.
I hope that through this book, you will quickly learn the basics and become an analyst who can freely utilize R for your own problems.
Heewon Jeon (Data Scientist, SK Telecom)
Publisher's Review
You can get started even if you have no experience with statistics or programming!
It's okay even if you don't have an IT major or know nothing about data analysis.
This book is structured so that even beginners to data analysis can easily get started with easy examples and gradually become familiar with R code through hands-on practice.
By the time you finish the exercises in this book, you will have mastered data analysis techniques.
Not only that, you can experience the entire process of data analysis projects in the field, from data purification, processing, and analysis to graph drawing.
At the end, you will complete your own excellent data analysis project using public data.
Learn about the latest and most popular packages in R.
[Do it! Learn R Data Analysis Easily] covers a variety of emerging data analysis techniques, including statistical analysis, text mining for analyzing social network posts, map visualization for expressing regional characteristics, and interactive graphs that display desired results in real time.
The reason these techniques are available to everyone is because experts from around the world have created packages and made them available online for free.
There are currently over 10,000 packages available.
To use R effectively, it is important to not only have statistical knowledge but also to make good use of R's various packages.
This book will teach you how to use the most up-to-date and popular packages.
It also introduces how to find and utilize the package you need among numerous packages.
If you're preparing for a job in data analysis, start with R!
Domestic companies such as SKT, Nexon, and Shinhan Bank are already utilizing R!
Global companies are using R.
Google, Facebook, and Microsoft, which are leaders in the field of data analysis technology, as well as domestic companies with a lot of data-related work, such as telecommunications companies SKT and KT, and gaming companies Nexon and NCSoft, are already utilizing R.
If you're interested in data analysis or preparing for a job, quickly study with this book and take on the challenge of data analysis!
A fun and hands-on R data analysis course.
Perfect as a textbook for academies and universities!
This is a practice-oriented book that teaches the necessary functions by analyzing data from the beginning, rather than a boring encyclopedia-style book that teaches grammar one by one, so even beginners can learn it within two weeks.
In addition, it is suitable for self-study as well as academy or university textbook, as it allows for in-depth learning through the [Try It Yourself] quiz, where you can review what you have learned, and the [Analysis Challenge!] corner, where you can analyze actual data.
All of the practical materials in this book can be downloaded from the author's GitHub and the resource room on the Aegis Publishing website.
It would be good to study by following the book's exercises and comparing them with the code you wrote yourself.
GitHub: http://bit.ly/start_r
Easys Publishing website: www.easyspub.com [Data Room] Bulletin Board
A place to meet people to study together,
Let's study together in the 'Do it! Study Room'!
If you feel burdened by studying alone, try using the study cafe 'Do it! Study Room (cafe.naver.com/doitstudyroom)'.
Here you can find study members to study with.
Additionally, you can get answers to any questions or comments about this book by posting them on the [Questions and Answers] bulletin board on the Aegis Publishing website.
- When you want to find a study group member to study with: cafe.naver.com/doitstudyroom Do it! Study Room
- If you have any questions or comments about the book: www.easyspub.com [Question and Answer] bulletin board
GOODS SPECIFICS
- Date of issue: July 20, 2017
- Page count, weight, size: 376 pages | 776g | 188*257*30mm
- ISBN13: 9791187370949
- ISBN10: 1187370940
- KC Certification: Certification Type: Confirming Certification Number: -
You may also like
카테고리
korean


korean

![ELLE 엘르 A형 (여성월간) : 1월 [2026]](http://librairie.coreenne.fr/cdn/shop/files/3b70e1cf77cf67d6da56e0eb041901e8.jpg?v=1767265322&width=3840)


