

Report Writing Principles with PowerPoint
 |
Description
Book Introduction
The beginning and end of a report as told by a practical producer!
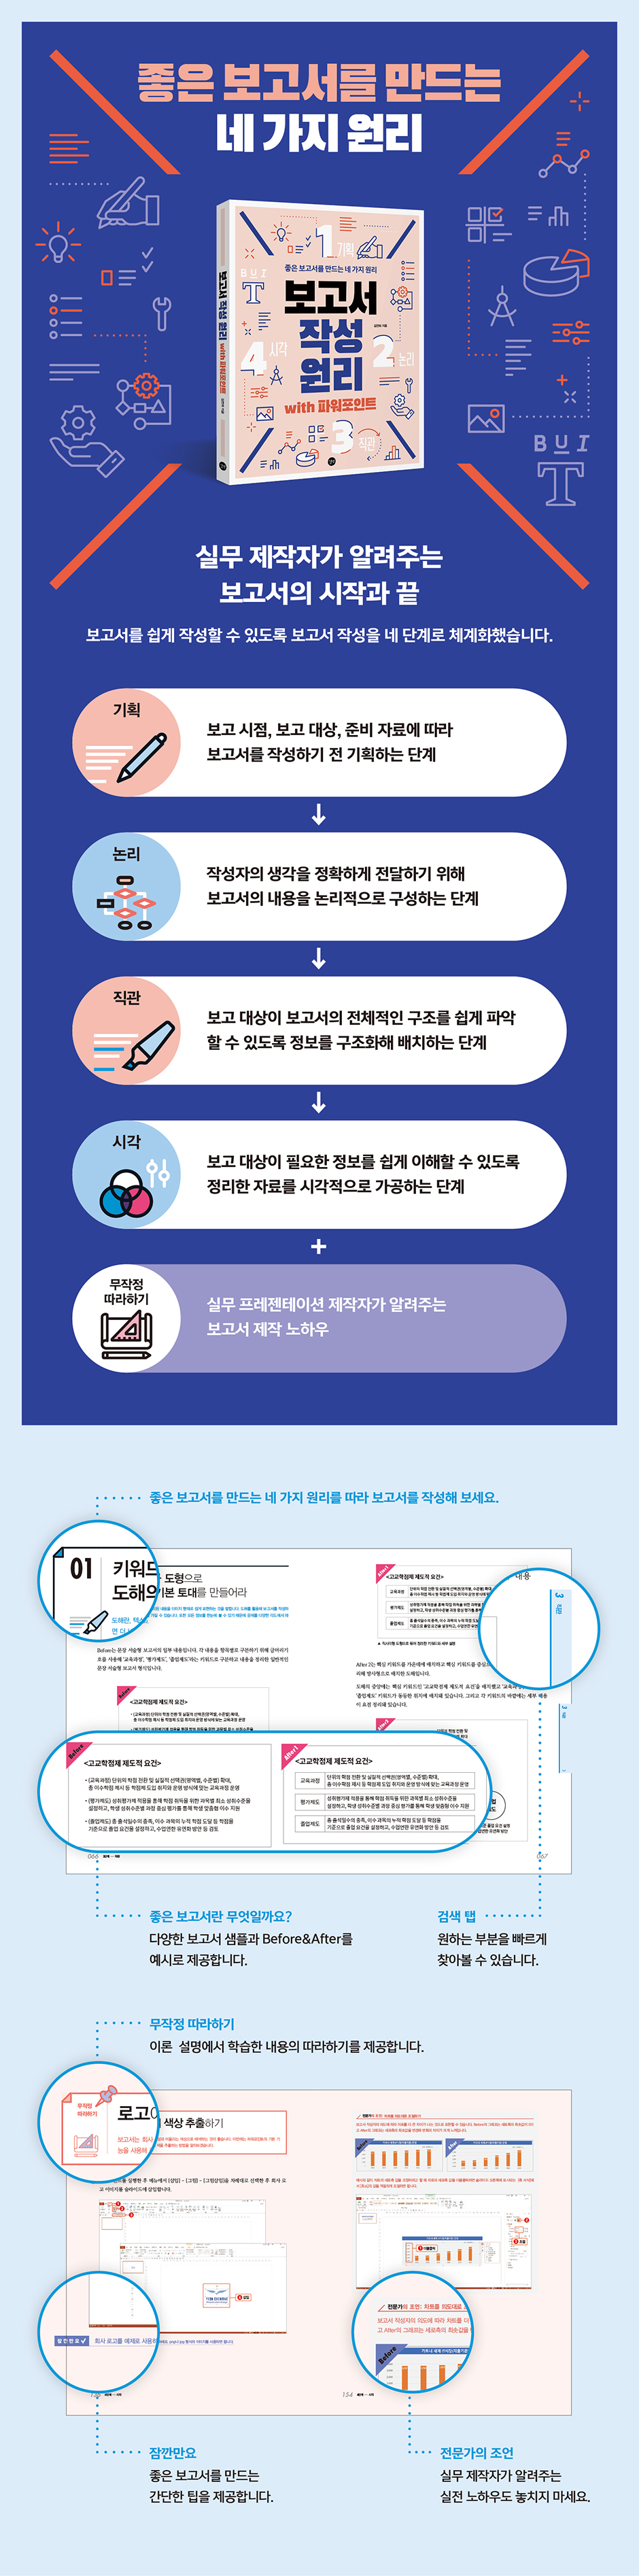
We systematized report writing into four stages: planning, logic, intuition, and vision.
Let's take a look at the four principles of creating a good report!
Four principles for creating a good report!
This book considers how to structure and present various reports, and systematizes report writing into four stages: planning, logic, intuition, and vision, so that anyone can easily write a report.
In the first stage of planning, we will look at how to plan a report based on the work situation and the target of the report, and in the second stage of logic, we will explain how to logically organize the report's title, table of contents, and contents.
And in Step 3, Intuition, we explain how to establish a hierarchy of report components and diagram them.
The final four steps will cover how to organize the elements of your report to create a visually appealing presentation, following the basic principles of design.
Let's learn the principles of report writing from a professional presentation maker.
We systematized report writing into four stages: planning, logic, intuition, and vision.
Let's take a look at the four principles of creating a good report!
Four principles for creating a good report!
This book considers how to structure and present various reports, and systematizes report writing into four stages: planning, logic, intuition, and vision, so that anyone can easily write a report.
In the first stage of planning, we will look at how to plan a report based on the work situation and the target of the report, and in the second stage of logic, we will explain how to logically organize the report's title, table of contents, and contents.
And in Step 3, Intuition, we explain how to establish a hierarchy of report components and diagram them.
The final four steps will cover how to organize the elements of your report to create a visually appealing presentation, following the basic principles of design.
Let's learn the principles of report writing from a professional presentation maker.
- You can preview some of the book's contents.
Preview
index
Step 1: Planning
01 Reports that vary depending on the work situation
-When reporting work in progress
-When reporting completed work
-When reporting on future work
02 Reports that vary depending on the reporting target
-If there is only one person to report to
-If there are multiple reporting targets
03 Reports that vary depending on the composition of the data
-Text-based material composition
-Illustration-based data composition
- Table-based data structure
- Chart-based data composition
-Image-based data composition
Step 2: Logic
01 A good report starts with a different title.
- A report that identifies the purpose and solution
- A report that shows the purpose and expected results
[Expert Advice] How to Organize Titles and Subheadings
02 A good report is different from the table of contents.
-Table of contents with the flow of Why - What - How
-Table of contents that allows you to predict the development of the content
03 A good report has a different structure of content.
-Why - What - How flow sentence narrative report
-Presentation-style report with the Why-What-How flow
- A structure encompassing past, present, and future time periods
04 Logic tree for logical reports
-Why so - So what to clarify the conclusion and reason of the pyramid
-Write a conclusion about the pyramid structure
-Logic tree for problem solving
[Expert Advice] Even complex content becomes easier when categorized by MECE.
[Just Follow] Creating a Logic Tree with PowerPoint
Step 3: Intuition
01 Create the basic foundation of the diagram using basic shapes.
02 Create a hierarchy of information
-Schematic of an equal relationship
- Diagram of superior-subordinate relationship
03 Use arrows to clarify information relationships.
-One-way arrow indicating change and movement
-Arrows indicating interrelationships
-Arrows indicating branches
-Arrows indicating results
-Arrows indicating convergence
-Arrows indicating diffusion
04 Guide your gaze to the ultimate goal.
05 Break down the sentences and organize the information in order.
[Expert Advice] Recognize the amount of information first.
06 Use diagrams appropriate to the purpose
-List-type diagram
-Step-by-step diagram
-Hierarchical diagram
- Ascending diagram
-Circular diagram
-Radial diagram
[Just Follow] Creating a Circular Diagram in PowerPoint
07 Convey information using graphs
-Represent the size with a bar graph.
-Represent the ratio with a circular graph.
- Show the trend over time using a broken line graph.
[Expert Advice] Creating Intuitive Graphs with Basic Shapes
[Just Follow] Creating Intuitive Graphs with Basic Shapes
[Just Follow] Creating a New Arrow with PowerPoint Shapes
Step 4: Vision
01 Basic Principles of Report Design ① Unification
-Unification: Unify the whole through repetition and continuity.
02 Basic Principles of Report Design ② Layout
-Placement: Place them close together or apart.
-Placement: Place in a stable composition.
[Just Follow] Adjusting Line Spacing in PowerPoint
03 Basic Principles of Report Design ③ Alignment
[Expert Advice] Always Check the Spacing Between Components
[Just follow along] Organize your PowerPoint presentations with the customization feature.
04 Basic Principles of Report Design ④ Emphasis
-Emphasis: Highlight important items using size contrast.
-Emphasis: Use color contrast to highlight important items.
05 Color composition of the report
-Understand the basics of color with the color wheel
[Expert Advice] Color Boxes in PowerPoint
-Color in similar colors
-Use complementary colors to emphasize
-Use neutral colors
-Use the colors of your company logo.
[Just follow along] Adjusting brightness with color boxes in PowerPoint
[Expert Advice] Adjust Hue, Brightness, and Saturation with PowerPoint's Color Boxes
[Just follow along] Extracting colors from a logo
06 Visual components of the report ① Text
-Text: Adjust text size in hierarchical order.
-Text: Separate text by adjusting the line spacing.
-Text: Emphasize text with color contrast.
07 Visual Components of the Report ② Table
-Table: Give order to the table.
-Table: Highlight important items
-Table: Use fewer colors
08 Visual Components of Report ③ Chart
-Charts: Make them concise and relevant to the situation.
-Charts: Highlight important items
[Just follow along] Deleting gridlines on a chart
09 Visual Components of the Report ④ Images
-Image: A full image speaks louder than words.
-Image: Extract and utilize the colors from the image.
-Image: Divide the screen into three equal parts and arrange the elements.
[Just follow along] Drawing a rule of thirds
[Just follow along] Adjusting the brightness of the logo image to match a dark background.
10 Visual Components of a Report ⑤ Icons and Margins
-Icon: An icon that serves as the center of attention
-Margins: Let the eyes move to the margins.
11. Let's turn a document-type report into a presentation report.
12 Real Case Reports Before & After
Search
01 Reports that vary depending on the work situation
-When reporting work in progress
-When reporting completed work
-When reporting on future work
02 Reports that vary depending on the reporting target
-If there is only one person to report to
-If there are multiple reporting targets
03 Reports that vary depending on the composition of the data
-Text-based material composition
-Illustration-based data composition
- Table-based data structure
- Chart-based data composition
-Image-based data composition
Step 2: Logic
01 A good report starts with a different title.
- A report that identifies the purpose and solution
- A report that shows the purpose and expected results
[Expert Advice] How to Organize Titles and Subheadings
02 A good report is different from the table of contents.
-Table of contents with the flow of Why - What - How
-Table of contents that allows you to predict the development of the content
03 A good report has a different structure of content.
-Why - What - How flow sentence narrative report
-Presentation-style report with the Why-What-How flow
- A structure encompassing past, present, and future time periods
04 Logic tree for logical reports
-Why so - So what to clarify the conclusion and reason of the pyramid
-Write a conclusion about the pyramid structure
-Logic tree for problem solving
[Expert Advice] Even complex content becomes easier when categorized by MECE.
[Just Follow] Creating a Logic Tree with PowerPoint
Step 3: Intuition
01 Create the basic foundation of the diagram using basic shapes.
02 Create a hierarchy of information
-Schematic of an equal relationship
- Diagram of superior-subordinate relationship
03 Use arrows to clarify information relationships.
-One-way arrow indicating change and movement
-Arrows indicating interrelationships
-Arrows indicating branches
-Arrows indicating results
-Arrows indicating convergence
-Arrows indicating diffusion
04 Guide your gaze to the ultimate goal.
05 Break down the sentences and organize the information in order.
[Expert Advice] Recognize the amount of information first.
06 Use diagrams appropriate to the purpose
-List-type diagram
-Step-by-step diagram
-Hierarchical diagram
- Ascending diagram
-Circular diagram
-Radial diagram
[Just Follow] Creating a Circular Diagram in PowerPoint
07 Convey information using graphs
-Represent the size with a bar graph.
-Represent the ratio with a circular graph.
- Show the trend over time using a broken line graph.
[Expert Advice] Creating Intuitive Graphs with Basic Shapes
[Just Follow] Creating Intuitive Graphs with Basic Shapes
[Just Follow] Creating a New Arrow with PowerPoint Shapes
Step 4: Vision
01 Basic Principles of Report Design ① Unification
-Unification: Unify the whole through repetition and continuity.
02 Basic Principles of Report Design ② Layout
-Placement: Place them close together or apart.
-Placement: Place in a stable composition.
[Just Follow] Adjusting Line Spacing in PowerPoint
03 Basic Principles of Report Design ③ Alignment
[Expert Advice] Always Check the Spacing Between Components
[Just follow along] Organize your PowerPoint presentations with the customization feature.
04 Basic Principles of Report Design ④ Emphasis
-Emphasis: Highlight important items using size contrast.
-Emphasis: Use color contrast to highlight important items.
05 Color composition of the report
-Understand the basics of color with the color wheel
[Expert Advice] Color Boxes in PowerPoint
-Color in similar colors
-Use complementary colors to emphasize
-Use neutral colors
-Use the colors of your company logo.
[Just follow along] Adjusting brightness with color boxes in PowerPoint
[Expert Advice] Adjust Hue, Brightness, and Saturation with PowerPoint's Color Boxes
[Just follow along] Extracting colors from a logo
06 Visual components of the report ① Text
-Text: Adjust text size in hierarchical order.
-Text: Separate text by adjusting the line spacing.
-Text: Emphasize text with color contrast.
07 Visual Components of the Report ② Table
-Table: Give order to the table.
-Table: Highlight important items
-Table: Use fewer colors
08 Visual Components of Report ③ Chart
-Charts: Make them concise and relevant to the situation.
-Charts: Highlight important items
[Just follow along] Deleting gridlines on a chart
09 Visual Components of the Report ④ Images
-Image: A full image speaks louder than words.
-Image: Extract and utilize the colors from the image.
-Image: Divide the screen into three equal parts and arrange the elements.
[Just follow along] Drawing a rule of thirds
[Just follow along] Adjusting the brightness of the logo image to match a dark background.
10 Visual Components of a Report ⑤ Icons and Margins
-Icon: An icon that serves as the center of attention
-Margins: Let the eyes move to the margins.
11. Let's turn a document-type report into a presentation report.
12 Real Case Reports Before & After
Search
Detailed image
Publisher's Review
"Report Writing Principles" introduces four principles for creating good reports.
Try writing your report according to the report writing principles that make good reports.
In Step 1 Planning, we learn how to plan an appropriate report based on the timing of the report, the target audience, and the prepared materials before writing the report.
A report is a document that summarizes the progress, results, and plans of a task. It is used to convey only the information necessary to the target audience, helping them understand or persuade them.
The structure of a report varies depending on when the report is written.
We'll look at how to plan a report and examples of actual reports.
In Step 2, you will learn how to logically structure the content of your report.
To ensure that the report's contents are accurately and easily conveyed to the target audience, we introduce how to logically organize the report, from the title to the table of contents and the structure of the content, and how to write a report that inspires trust in the target audience.
In Step 3, Intuition, you'll learn how to clearly organize your thoughts and convey only the essential information to your audience.
To easily understand the content of a descriptive report that is organized only in text, you must first understand the overall structure.
A diagram is a visualization of information using shapes. Using a diagram allows you to see the visualized information at a glance, making it easier to understand the relationships between each piece of information.
Diagramming is a technique for organizing the writer's thoughts and an expression technique that can easily convey information to the audience.
In Step 3, Intuition, we introduce how to use diagrams to intuitively convey the contents of the report.
In Step 4, you'll learn how to visually highlight the elements of your report so your audience can easily understand the information they need.
Reports are tools for persuasion, and to create a visually appealing report, you need to eliminate meaningless elements and only include meaningful ones.
To simplify and streamline your report, leaving only the essential elements uncluttered, we'll introduce how to arrange the text, tables, charts, and images that make up your report according to the basic principles of report design.
Since document-type reports are written primarily with text, there is no need to worry about design, but presentation-type reports inevitably feel burdened because they require attention to diagrams, color schemes, and layout.
In the Before & After case study report, we walk through the process of writing a real presentation-style report and introduce ways to write a better report.
Try writing your report according to the report writing principles that make good reports.
In Step 1 Planning, we learn how to plan an appropriate report based on the timing of the report, the target audience, and the prepared materials before writing the report.
A report is a document that summarizes the progress, results, and plans of a task. It is used to convey only the information necessary to the target audience, helping them understand or persuade them.
The structure of a report varies depending on when the report is written.
We'll look at how to plan a report and examples of actual reports.
In Step 2, you will learn how to logically structure the content of your report.
To ensure that the report's contents are accurately and easily conveyed to the target audience, we introduce how to logically organize the report, from the title to the table of contents and the structure of the content, and how to write a report that inspires trust in the target audience.
In Step 3, Intuition, you'll learn how to clearly organize your thoughts and convey only the essential information to your audience.
To easily understand the content of a descriptive report that is organized only in text, you must first understand the overall structure.
A diagram is a visualization of information using shapes. Using a diagram allows you to see the visualized information at a glance, making it easier to understand the relationships between each piece of information.
Diagramming is a technique for organizing the writer's thoughts and an expression technique that can easily convey information to the audience.
In Step 3, Intuition, we introduce how to use diagrams to intuitively convey the contents of the report.
In Step 4, you'll learn how to visually highlight the elements of your report so your audience can easily understand the information they need.
Reports are tools for persuasion, and to create a visually appealing report, you need to eliminate meaningless elements and only include meaningful ones.
To simplify and streamline your report, leaving only the essential elements uncluttered, we'll introduce how to arrange the text, tables, charts, and images that make up your report according to the basic principles of report design.
Since document-type reports are written primarily with text, there is no need to worry about design, but presentation-type reports inevitably feel burdened because they require attention to diagrams, color schemes, and layout.
In the Before & After case study report, we walk through the process of writing a real presentation-style report and introduce ways to write a better report.
GOODS SPECIFICS
- Publication date: December 24, 2020
- Page count, weight, size: 208 pages | 183*235*12mm
- ISBN13: 9791165214067
- ISBN10: 1165214067
You may also like
카테고리
korean


korean

![GQ KOREA Mark (Monthly): December [2025]](http://librairie.coreenne.fr/cdn/shop/files/8ef265dbbfbf186523ed75ba7319009d.jpg?v=1765340328&width=3840)


