

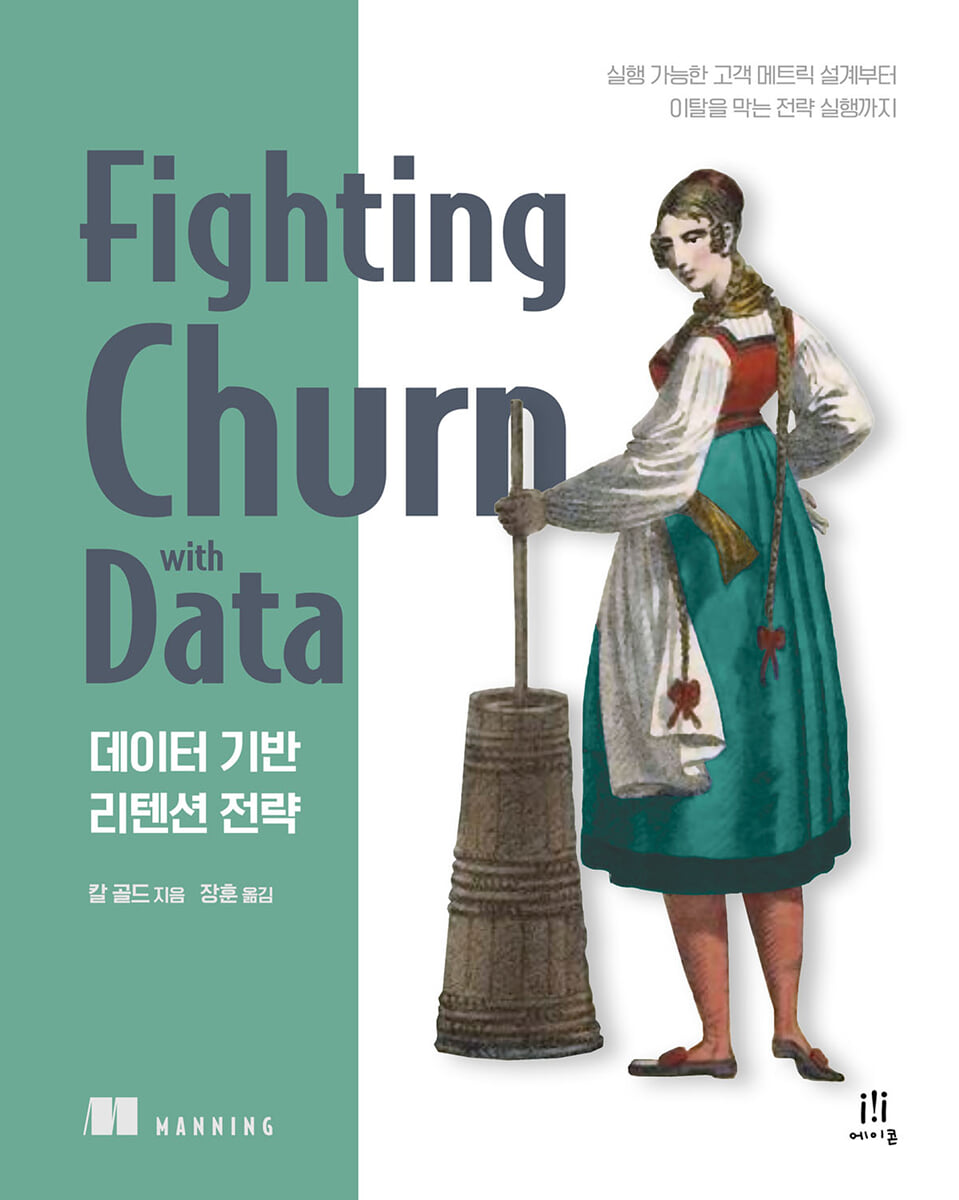
Data-Driven Retention Strategy
 |
Description
Book Introduction
Catching Customer Churn with Data - Everything You Need to Know in a Practical Analytics Guide!
From "Churn Prediction" to "Actual Behavior Change," a Complete Roadmap for Data Producers
"Data-Driven Retention Strategy" contains practical data analysis methodologies that help effectively address customer churn issues not only in subscription services but also in all business settings where repeat customers are crucial.
This book goes beyond simply building predictive models; it also presents actionable strategies to reduce churn and increase customer value.
Author Carl Gold meticulously analyzes customer behavior data, drawing on raw data collected from various industries around the world, to derive "actionable customer metrics."
Additionally, it provides a wealth of analytical processes, Python and SQL usage techniques, and benchmark cases from real-world companies, all meticulously designed for data scientists, analysts, machine learning engineers, and other data professionals.
It candidly illuminates the challenges and pitfalls of data-driven churn analysis, particularly from a practical perspective, and provides detailed guidance on how to effectively communicate the results to teams and business decision-making.
Therefore, the core concepts are explained in a way that anyone can easily understand, and even readers unfamiliar with coding can quickly absorb the main content through case studies, summaries, and practical tips.
As every industry shifts to "as a service" and repeat customers become increasingly important, this book is a must-read for businesses and data professionals seeking to reduce customer churn and achieve sustainable growth through data.
From "Churn Prediction" to "Actual Behavior Change," a Complete Roadmap for Data Producers
"Data-Driven Retention Strategy" contains practical data analysis methodologies that help effectively address customer churn issues not only in subscription services but also in all business settings where repeat customers are crucial.
This book goes beyond simply building predictive models; it also presents actionable strategies to reduce churn and increase customer value.
Author Carl Gold meticulously analyzes customer behavior data, drawing on raw data collected from various industries around the world, to derive "actionable customer metrics."
Additionally, it provides a wealth of analytical processes, Python and SQL usage techniques, and benchmark cases from real-world companies, all meticulously designed for data scientists, analysts, machine learning engineers, and other data professionals.
It candidly illuminates the challenges and pitfalls of data-driven churn analysis, particularly from a practical perspective, and provides detailed guidance on how to effectively communicate the results to teams and business decision-making.
Therefore, the core concepts are explained in a way that anyone can easily understand, and even readers unfamiliar with coding can quickly absorb the main content through case studies, summaries, and practical tips.
As every industry shifts to "as a service" and repeat customers become increasingly important, this book is a must-read for businesses and data professionals seeking to reduce customer churn and achieve sustainable growth through data.
- You can preview some of the book's contents.
Preview
index
Recommendation
preface
Acknowledgements
About the Author
Translator's Introduction
Translator's Note
Entering
Part 1: Building an Armory
Chapter 1: The World of Detachment
1.1 Why Read This Book
1.1.1 Common Exit Scenarios
1.1.2 Topic of this book
1.2 Fighting against Detachment
1.2.1 Interventions to reduce dropout
1.2.2 Why Fighting Withdrawal Is Difficult
1.2.3 Customer Metrics: Your Weapons for Fighting Churn
1.3 Differences from general data analysis books
1.3.1 Practical and detailed information
1.3.2 Simulation Case Study
1.4 Products with which users interact repeatedly
1.4.1 Paid Consumer Goods
1.4.2 B2B Services
1.4.3 Ad-Based Media and Apps
1.4.4 Consumer Feed Subscription Service
1.4.5 Partially Paid Business Model
1.4.6 In-App Purchase Model
1.5 Churn Scenarios for Non-Subscription Services
1.5.1 Dormant status considered as departure
1.5.2 Free Trial Conversion
1.5.3 Upselling/Downselling
1.5.4 Other Yes/No (Binomial) Customer Prediction
1.5.5 Predicting Customer Behavior
1.5.6 Use Cases Other Than Exit
1.6 Customer Behavior Data
1.6.1 Customer Events in General Product Categories
1.6.2 Most important events
1.7 Case Study of Fighting Deviation
1.7.1 Klipfolio
1.7.2 Broadly
1.7.3 Versature
1.7.4 Social Network Simulation
1.8 Case Studies on Outstanding Customer Metrics
1.8.1 Usability
1.8.2 Success rate
1.8.3 Unit price
summation
Chapter 2 Deviation Measurement
2.1 Definition of churn rate
2.1.1 Calculating Churn and Retention Rates
2.1.2 Relationship between churn rate and retention rate
2.2 Subscription Database
2.3 Basic Churn Calculation: Net Retention
2.3.1 Calculating net retention
2.3.2 Calculating SQL Net Retention
2.3.3 Interpreting Net Retention
2.4 Standard Account-Based Exit
2.4.1 Definition of standard churn rate
2.4.2 Outer join for departure calculation
2.4.3 Calculating Standard Deviation via SQL
2.4.4 When to Use Standard Churn Rates
2.5 Activity (event-based) churn for non-subscription products
2.5.1 Defining Churn by Active Accounts and Events
2.5.2 Calculating Activity Churn via SQL
2.6 Advanced Churn: Monthly Recurring Revenue (MRR) Churn
2.6.1 MRR Deviation Definition and Calculation
2.6.2 Calculating MRR Churn Using SQL
2.6.3 MRR Churn vs. Account Churn vs. Net (Retention) Churn
2.7 Transformation of churn rate measurement
2.7.1 Survivor Analysis (Advanced)
2.7.2 Conversion of churn rate
2.7.3 Converting All Churn Measurement Periods in SQL
2.7.4 Selecting the departure measurement period
2.7.5 Seasonality and Churn
summation
Chapter 3: Customer Measurement
3.1 From Event to Metric
3.2 Event Data Warehouse Schema
3.3 Aggregating events for a single period
3.4 Details of Metric Period Definition
3.4.1 Weekly Action Cycle
3.4.2 Timestamp of metric measurements
3.5 Measurements at different points in time
3.5.1 Overlapping measurement periods
3.5.2 Metric Measurement Timing
3.5.3 Saving Metric Measurements
3.5.4 Saving metrics for simulation examples
3.6 Sum and average measurements of event attributes
3.7 Metric Quality Assurance
3.7.1 Testing Metric Changes Over Time
3.7.2 Metric Quality Assurance (QA) Case Study
3.7.3 Check the number of accounts with metrics
3.8 Event QA
3.8.1 Checking Event Changes Over Time
3.8.2 Check events per account
3.9 Choosing a Measurement Period for Behavioral Measurements
3.10 Account Maintenance Period Measurement
3.10.1 Defining Account Retention Period
3.10.2 Recursive table expression for account retention periods
3.10.3 Account Maintenance Period SQL Program
3.11 Measuring MRR and Other Subscription Metrics
3.11.1 Calculating MRR as a Metric
3.11.2 Subscriptions for a specific amount
3.11.3 Calculating Subscription Unit Quantity as a Metric
3.11.4 Calculating Billing Period as a Metric
summation
Chapter 4: Observing Updates and Departures
4.1 Introduction to the Dataset
4.2 Customer Observation Methods
4.2.1 Observation lead time
4.2.2 Observing the sequence of updates and departures
4.2.3 Overview of Creating a Subscription Dataset
4.3 Identifying the Active Period in a Subscription
4.3.1 Active Period
4.3.2 Active Period Storage Schema
4.3.3 Finding the Active Period in Progress
4.3.4 Finding active periods ending in departures
4.4 Check the activation period of non-subscription products
4.4.1 Defining the Active Period
4.4.2 Process of forming a dataset from events
4.4.3 SQL for calculating activity weeks
4.5 Select the observation date
4.5.1 Balancing Deviation and Non-Deviation Observations
4.5.2 Observation Date Selection Algorithm
4.5.3 Observation Date SQL Program
4.6 Exporting the Outlier Dataset
4.6.1 Dataset Creation SQL Program
4.7 Exporting Current Customers for Segmentation
4.7.1 Selecting Active Accounts and Metrics
4.7.2 Metric-Based Customer Segmentation
summation
Part 2: War Begins
Chapter 5: Understanding Churn and Behavior Through Metrics
5.1 Metric Cohort Analysis
5.1.1 Basic Concepts of Cohort Analysis
5.1.2 Python Cohort Analysis
5.1.3 Product Usage Cohort
5.1.4 Account Retention Period Cohort
5.1.5 Cohort Analysis for Billing Period
5.1.6 Minimum cohort size
5.1.7 Differences between significant and non-significant cohorts
5.1.8 Metric cohorts where most customer metrics are 0
5.1.9 Causality: Are Metrics Causing Churn?
5.2 Summary of Customer Behavior
5.2.1 Understanding the Distribution of Metrics
5.2.2 Computing Summary Statistics on a Dataset with Python
5.2.3 Excluding Rare Metrics
5.2.4 Involving Business Owners in Data Quality Assurance
5.3 Metric Scoring
5.3.1 Basic Concepts of Metric Scores
5.3.2 Metric Scoring Algorithm
5.3.3 Calculating Metric Scores with Python
5.3.4 Cohort Analysis Using Score Metrics
5.3.5 Cohort Analysis for Monthly Recurring Revenue
5.4 Deleting unwanted or invalid observations
5.4.1 Removing Unpaid Customers from Churn Analysis
5.4.2 Removing Observations Based on Metric Thresholds in Python
5.4.3 Removing Zero Measurements from Rare Metric Analysis
5.4.4 Churn Behavior: Metrics Related to Increased Churn Rate
5.5 Customer Segmentation through Cohort Analysis
5.5.1 Segmentation Process
5.5.2 Selecting segment criteria
summation
Chapter 6: Relationships Between Customer Behaviors
6.1 Correlation between actions
6.1.1 Correlation between pairs of metrics
6.1.2 Investigating Correlations with Python
6.1.3 Understanding Correlations Between Metric Sets Using Correlation Matrices
6.1.4 Correlation Matrix of Case Studies
6.1.5 Computing Correlation Matrices in Python
6.2 Average bets for behavioral metrics groups
6.2.1 Why Averaging Correlated Metric Scores?
6.2.2 Averaging scores using a weight matrix (loading matrix)
6.2.3 Loading Matrix Case Study
6.2.4 Applying Load Matrices in Python
6.2.5 Attrition Cohort Analysis for Metric Group Mean Score
6.3 Discovering Groups of Interrelated Metrics
6.3.1 Grouping Metrics by Clustering Correlations
6.3.2 Correlation Clustering in Python
6.3.3 Loading matrix weights that convert score averages into scores
6.3.4 Running the Metric Grouping and Grouped Cohort Analysis Code
6.3.5 Choosing a Correlation Threshold for Clustering
6.4 Explaining Interrelated Metric Groups to Business Owners
summation
Chapter 7: Segmenting Customers with Advanced Metrics
7.1 Ratio Metrics
7.1.1 When and Why to Use Ratio Metrics
7.1.2 How to Calculate Ratio Metrics
7.1.3 Example Ratio Metric Case Study
7.1.4 Additional ratio metrics for simulated social networks
7.2 Percentage of total metrics
7.2.1 Calculating Percentages of Total Metrics
7.2.2 Case Study of Percentage of Sum Metric for Two Metrics
7.2.3 Case Study of Percentage of Total Metrics for Multiple Metrics
7.3 Metrics to Measure Change
7.3.1 Measuring Activity Level Changes
7.3.2 Scores for metrics with extreme outliers (fat tails)
7.3.3 Measuring time since last activity
7.4 Adjusting the Metric Period
7.4.1 Scaling long metrics to short periods
7.4.2 Estimating Metrics for New Accounts
7.5 User Metrics
7.5.1 Measuring Active Users
7.5.2 Active User Metrics
7.6 What ratio should I use?
7.6.1 Why use ratios, and what else?
7.6.2 What ratio should I use?
summation
Part 3 Special Weapons and Tactics
Chapter 8: Predicting Exits
8.1 Predicting Churn Using Models
8.1.1 Probability Prediction Using Models
8.1.2 Engagement and Retention Probabilities
8.1.3 Engagement and Customer Behavior
8.1.4 Offset to match observed churn rate to S-curve
8.1.5 Calculating Logistic Regression Probabilities
8.2 Data Preparation Review
8.3 Fitting the Deviation Model
8.3.1 Logistic Regression Analysis Results
8.3.2 Logistic Regression Code
8.3.3 Explaining Logistic Regression Results
8.3.4 Logistic Regression Case Study
8.3.5 Correction and Past Deviation Probabilities
8.4 Predicting the probability of leaving
8.4.1 Preparing the Current Customer Dataset for Prediction
8.4.2 Preparing Current Customer Data for Segmentation
8.4.3 Predicting Using a Saved Model
8.4.4 Prediction Case Study
8.4.5 Forecast Correction and Forecast Trend
8.5 The Pitfalls of Departure Prediction
8.5.1 Correlation Metrics
8.5.2 Outliers
8.6 Customer Lifetime Value
8.6.1 Meaning of CLV
8.6.2 From Churn to Expected Customer Lifetime
8.6.3 CLV formula
summation
Chapter 9: Prediction Accuracy and Machine Learning
9.1 Measuring the Accuracy of Departure Prediction
9.1.1 Why not use standard accuracy measurements for departures?
9.1.2 Measuring Attrition Prediction Accuracy with AUC
9.1.3 Measuring the Accuracy of Deviation Prediction Through Improvement
9.2 Past Accuracy Simulation: Backtesting
9.2.1 Purpose and Reason for Backtesting
9.2.2 Backtest Code
9.2.3 Backtesting Considerations and Risk Factors
9.3 Regression Control Parameters
9.3.1 Controlling the Strength and Number of Regression Weights
9.3.2 Regression Analysis Using Control Parameters
9.4 Selecting Regression Parameters Through Testing (Cross-Validation)
9.4.1 Cross-validation
9.4.2 Cross-validation code
9.4.3 Regression Cross-Validation Case Study
9.5 Predicting Churn Risk Using Machine Learning
9.5.1 XGBoost Training Model
9.5.2 XGBoost Cross-Validation
9.5.3 Comparing the Accuracy of XGBoost and Regression
9.5.4 Comparing Advanced and Basic Metrics
9.6 Customer Segmentation Using Machine Learning Predictions
summation
Chapter 10: Demographic and Corporate Statistics
10.1 Demographic and Business Statistics Datasets
10.1.1 Types of Demographic and Business Statistics Data
10.1.2 Account Data Model for Social Network Simulation
10.1.3 Demographic Dataset SQL
10.2 Attrition Cohorts in Demographics and Firm Statistics Categories
10.2.1 Churn Cohorts by Demographic Category
10.2.2 Confidence Intervals for Dropout Rates
10.2.3 Comparing Demographic Cohorts with Confidence Intervals
10.3 Grouping demographic categories
10.3.1 Representing Groups with Mapping Dictionaries
10.3.2 Cohort Analysis Using Grouped Categories
10.3.3 Designing Category Groups
10.4 Churn Analysis for Date and Numeric Demographics
10.5 Predicting Churn Using Demographic Data
10.5.1 Converting a Text Field to a Dummy Variable
10.5.2 Predicting Attrition Using Only Categorical Dummy Variables
10.5.3 Combining Dummy Variables with Numeric Data
10.5.4 Combining Demographics and Metrics to Predict Churn
10.6 Segmenting Current Customers with Demographic Data
summation
Chapter 11: Leading the Fight Against Defection
11.1 Planning to Combat Defection
11.1.1 Data Processing and Analysis Checklist
11.1.2 Communicating About the Business Checklist
11.2 Running the book's code with your own data
11.2.1 Importing Data with This Book's Data Schema
11.2.2 Running Code with Your Own Data
11.3 Porting the code in this book to another environment
11.3.1 Porting SQL Code
11.3.2 Porting Python Code
11.4 Further Learning and Contact
11.4.1 Author's Blog Site and Social Media
11.4.2 Departure Benchmark Information Data
11.4.3 Other information about the departure
11.4.4 Products that help with withdrawal
summation
Search
preface
Acknowledgements
About the Author
Translator's Introduction
Translator's Note
Entering
Part 1: Building an Armory
Chapter 1: The World of Detachment
1.1 Why Read This Book
1.1.1 Common Exit Scenarios
1.1.2 Topic of this book
1.2 Fighting against Detachment
1.2.1 Interventions to reduce dropout
1.2.2 Why Fighting Withdrawal Is Difficult
1.2.3 Customer Metrics: Your Weapons for Fighting Churn
1.3 Differences from general data analysis books
1.3.1 Practical and detailed information
1.3.2 Simulation Case Study
1.4 Products with which users interact repeatedly
1.4.1 Paid Consumer Goods
1.4.2 B2B Services
1.4.3 Ad-Based Media and Apps
1.4.4 Consumer Feed Subscription Service
1.4.5 Partially Paid Business Model
1.4.6 In-App Purchase Model
1.5 Churn Scenarios for Non-Subscription Services
1.5.1 Dormant status considered as departure
1.5.2 Free Trial Conversion
1.5.3 Upselling/Downselling
1.5.4 Other Yes/No (Binomial) Customer Prediction
1.5.5 Predicting Customer Behavior
1.5.6 Use Cases Other Than Exit
1.6 Customer Behavior Data
1.6.1 Customer Events in General Product Categories
1.6.2 Most important events
1.7 Case Study of Fighting Deviation
1.7.1 Klipfolio
1.7.2 Broadly
1.7.3 Versature
1.7.4 Social Network Simulation
1.8 Case Studies on Outstanding Customer Metrics
1.8.1 Usability
1.8.2 Success rate
1.8.3 Unit price
summation
Chapter 2 Deviation Measurement
2.1 Definition of churn rate
2.1.1 Calculating Churn and Retention Rates
2.1.2 Relationship between churn rate and retention rate
2.2 Subscription Database
2.3 Basic Churn Calculation: Net Retention
2.3.1 Calculating net retention
2.3.2 Calculating SQL Net Retention
2.3.3 Interpreting Net Retention
2.4 Standard Account-Based Exit
2.4.1 Definition of standard churn rate
2.4.2 Outer join for departure calculation
2.4.3 Calculating Standard Deviation via SQL
2.4.4 When to Use Standard Churn Rates
2.5 Activity (event-based) churn for non-subscription products
2.5.1 Defining Churn by Active Accounts and Events
2.5.2 Calculating Activity Churn via SQL
2.6 Advanced Churn: Monthly Recurring Revenue (MRR) Churn
2.6.1 MRR Deviation Definition and Calculation
2.6.2 Calculating MRR Churn Using SQL
2.6.3 MRR Churn vs. Account Churn vs. Net (Retention) Churn
2.7 Transformation of churn rate measurement
2.7.1 Survivor Analysis (Advanced)
2.7.2 Conversion of churn rate
2.7.3 Converting All Churn Measurement Periods in SQL
2.7.4 Selecting the departure measurement period
2.7.5 Seasonality and Churn
summation
Chapter 3: Customer Measurement
3.1 From Event to Metric
3.2 Event Data Warehouse Schema
3.3 Aggregating events for a single period
3.4 Details of Metric Period Definition
3.4.1 Weekly Action Cycle
3.4.2 Timestamp of metric measurements
3.5 Measurements at different points in time
3.5.1 Overlapping measurement periods
3.5.2 Metric Measurement Timing
3.5.3 Saving Metric Measurements
3.5.4 Saving metrics for simulation examples
3.6 Sum and average measurements of event attributes
3.7 Metric Quality Assurance
3.7.1 Testing Metric Changes Over Time
3.7.2 Metric Quality Assurance (QA) Case Study
3.7.3 Check the number of accounts with metrics
3.8 Event QA
3.8.1 Checking Event Changes Over Time
3.8.2 Check events per account
3.9 Choosing a Measurement Period for Behavioral Measurements
3.10 Account Maintenance Period Measurement
3.10.1 Defining Account Retention Period
3.10.2 Recursive table expression for account retention periods
3.10.3 Account Maintenance Period SQL Program
3.11 Measuring MRR and Other Subscription Metrics
3.11.1 Calculating MRR as a Metric
3.11.2 Subscriptions for a specific amount
3.11.3 Calculating Subscription Unit Quantity as a Metric
3.11.4 Calculating Billing Period as a Metric
summation
Chapter 4: Observing Updates and Departures
4.1 Introduction to the Dataset
4.2 Customer Observation Methods
4.2.1 Observation lead time
4.2.2 Observing the sequence of updates and departures
4.2.3 Overview of Creating a Subscription Dataset
4.3 Identifying the Active Period in a Subscription
4.3.1 Active Period
4.3.2 Active Period Storage Schema
4.3.3 Finding the Active Period in Progress
4.3.4 Finding active periods ending in departures
4.4 Check the activation period of non-subscription products
4.4.1 Defining the Active Period
4.4.2 Process of forming a dataset from events
4.4.3 SQL for calculating activity weeks
4.5 Select the observation date
4.5.1 Balancing Deviation and Non-Deviation Observations
4.5.2 Observation Date Selection Algorithm
4.5.3 Observation Date SQL Program
4.6 Exporting the Outlier Dataset
4.6.1 Dataset Creation SQL Program
4.7 Exporting Current Customers for Segmentation
4.7.1 Selecting Active Accounts and Metrics
4.7.2 Metric-Based Customer Segmentation
summation
Part 2: War Begins
Chapter 5: Understanding Churn and Behavior Through Metrics
5.1 Metric Cohort Analysis
5.1.1 Basic Concepts of Cohort Analysis
5.1.2 Python Cohort Analysis
5.1.3 Product Usage Cohort
5.1.4 Account Retention Period Cohort
5.1.5 Cohort Analysis for Billing Period
5.1.6 Minimum cohort size
5.1.7 Differences between significant and non-significant cohorts
5.1.8 Metric cohorts where most customer metrics are 0
5.1.9 Causality: Are Metrics Causing Churn?
5.2 Summary of Customer Behavior
5.2.1 Understanding the Distribution of Metrics
5.2.2 Computing Summary Statistics on a Dataset with Python
5.2.3 Excluding Rare Metrics
5.2.4 Involving Business Owners in Data Quality Assurance
5.3 Metric Scoring
5.3.1 Basic Concepts of Metric Scores
5.3.2 Metric Scoring Algorithm
5.3.3 Calculating Metric Scores with Python
5.3.4 Cohort Analysis Using Score Metrics
5.3.5 Cohort Analysis for Monthly Recurring Revenue
5.4 Deleting unwanted or invalid observations
5.4.1 Removing Unpaid Customers from Churn Analysis
5.4.2 Removing Observations Based on Metric Thresholds in Python
5.4.3 Removing Zero Measurements from Rare Metric Analysis
5.4.4 Churn Behavior: Metrics Related to Increased Churn Rate
5.5 Customer Segmentation through Cohort Analysis
5.5.1 Segmentation Process
5.5.2 Selecting segment criteria
summation
Chapter 6: Relationships Between Customer Behaviors
6.1 Correlation between actions
6.1.1 Correlation between pairs of metrics
6.1.2 Investigating Correlations with Python
6.1.3 Understanding Correlations Between Metric Sets Using Correlation Matrices
6.1.4 Correlation Matrix of Case Studies
6.1.5 Computing Correlation Matrices in Python
6.2 Average bets for behavioral metrics groups
6.2.1 Why Averaging Correlated Metric Scores?
6.2.2 Averaging scores using a weight matrix (loading matrix)
6.2.3 Loading Matrix Case Study
6.2.4 Applying Load Matrices in Python
6.2.5 Attrition Cohort Analysis for Metric Group Mean Score
6.3 Discovering Groups of Interrelated Metrics
6.3.1 Grouping Metrics by Clustering Correlations
6.3.2 Correlation Clustering in Python
6.3.3 Loading matrix weights that convert score averages into scores
6.3.4 Running the Metric Grouping and Grouped Cohort Analysis Code
6.3.5 Choosing a Correlation Threshold for Clustering
6.4 Explaining Interrelated Metric Groups to Business Owners
summation
Chapter 7: Segmenting Customers with Advanced Metrics
7.1 Ratio Metrics
7.1.1 When and Why to Use Ratio Metrics
7.1.2 How to Calculate Ratio Metrics
7.1.3 Example Ratio Metric Case Study
7.1.4 Additional ratio metrics for simulated social networks
7.2 Percentage of total metrics
7.2.1 Calculating Percentages of Total Metrics
7.2.2 Case Study of Percentage of Sum Metric for Two Metrics
7.2.3 Case Study of Percentage of Total Metrics for Multiple Metrics
7.3 Metrics to Measure Change
7.3.1 Measuring Activity Level Changes
7.3.2 Scores for metrics with extreme outliers (fat tails)
7.3.3 Measuring time since last activity
7.4 Adjusting the Metric Period
7.4.1 Scaling long metrics to short periods
7.4.2 Estimating Metrics for New Accounts
7.5 User Metrics
7.5.1 Measuring Active Users
7.5.2 Active User Metrics
7.6 What ratio should I use?
7.6.1 Why use ratios, and what else?
7.6.2 What ratio should I use?
summation
Part 3 Special Weapons and Tactics
Chapter 8: Predicting Exits
8.1 Predicting Churn Using Models
8.1.1 Probability Prediction Using Models
8.1.2 Engagement and Retention Probabilities
8.1.3 Engagement and Customer Behavior
8.1.4 Offset to match observed churn rate to S-curve
8.1.5 Calculating Logistic Regression Probabilities
8.2 Data Preparation Review
8.3 Fitting the Deviation Model
8.3.1 Logistic Regression Analysis Results
8.3.2 Logistic Regression Code
8.3.3 Explaining Logistic Regression Results
8.3.4 Logistic Regression Case Study
8.3.5 Correction and Past Deviation Probabilities
8.4 Predicting the probability of leaving
8.4.1 Preparing the Current Customer Dataset for Prediction
8.4.2 Preparing Current Customer Data for Segmentation
8.4.3 Predicting Using a Saved Model
8.4.4 Prediction Case Study
8.4.5 Forecast Correction and Forecast Trend
8.5 The Pitfalls of Departure Prediction
8.5.1 Correlation Metrics
8.5.2 Outliers
8.6 Customer Lifetime Value
8.6.1 Meaning of CLV
8.6.2 From Churn to Expected Customer Lifetime
8.6.3 CLV formula
summation
Chapter 9: Prediction Accuracy and Machine Learning
9.1 Measuring the Accuracy of Departure Prediction
9.1.1 Why not use standard accuracy measurements for departures?
9.1.2 Measuring Attrition Prediction Accuracy with AUC
9.1.3 Measuring the Accuracy of Deviation Prediction Through Improvement
9.2 Past Accuracy Simulation: Backtesting
9.2.1 Purpose and Reason for Backtesting
9.2.2 Backtest Code
9.2.3 Backtesting Considerations and Risk Factors
9.3 Regression Control Parameters
9.3.1 Controlling the Strength and Number of Regression Weights
9.3.2 Regression Analysis Using Control Parameters
9.4 Selecting Regression Parameters Through Testing (Cross-Validation)
9.4.1 Cross-validation
9.4.2 Cross-validation code
9.4.3 Regression Cross-Validation Case Study
9.5 Predicting Churn Risk Using Machine Learning
9.5.1 XGBoost Training Model
9.5.2 XGBoost Cross-Validation
9.5.3 Comparing the Accuracy of XGBoost and Regression
9.5.4 Comparing Advanced and Basic Metrics
9.6 Customer Segmentation Using Machine Learning Predictions
summation
Chapter 10: Demographic and Corporate Statistics
10.1 Demographic and Business Statistics Datasets
10.1.1 Types of Demographic and Business Statistics Data
10.1.2 Account Data Model for Social Network Simulation
10.1.3 Demographic Dataset SQL
10.2 Attrition Cohorts in Demographics and Firm Statistics Categories
10.2.1 Churn Cohorts by Demographic Category
10.2.2 Confidence Intervals for Dropout Rates
10.2.3 Comparing Demographic Cohorts with Confidence Intervals
10.3 Grouping demographic categories
10.3.1 Representing Groups with Mapping Dictionaries
10.3.2 Cohort Analysis Using Grouped Categories
10.3.3 Designing Category Groups
10.4 Churn Analysis for Date and Numeric Demographics
10.5 Predicting Churn Using Demographic Data
10.5.1 Converting a Text Field to a Dummy Variable
10.5.2 Predicting Attrition Using Only Categorical Dummy Variables
10.5.3 Combining Dummy Variables with Numeric Data
10.5.4 Combining Demographics and Metrics to Predict Churn
10.6 Segmenting Current Customers with Demographic Data
summation
Chapter 11: Leading the Fight Against Defection
11.1 Planning to Combat Defection
11.1.1 Data Processing and Analysis Checklist
11.1.2 Communicating About the Business Checklist
11.2 Running the book's code with your own data
11.2.1 Importing Data with This Book's Data Schema
11.2.2 Running Code with Your Own Data
11.3 Porting the code in this book to another environment
11.3.1 Porting SQL Code
11.3.2 Porting Python Code
11.4 Further Learning and Contact
11.4.1 Author's Blog Site and Social Media
11.4.2 Departure Benchmark Information Data
11.4.3 Other information about the departure
11.4.4 Products that help with withdrawal
summation
Search
Publisher's Review
1.
Breaking Through "Churning" - The Key to Unlocking the Secrets of Repeat Customers
Churn is a real problem that all companies providing products and services must face, and it is an indicator that determines the very survival of a business.
"Data-Driven Retention Strategy" breaks down the complex nature of why customers churn, how to define churn, and where to start measuring it.
Whether your business relies on subscriptions or regular repeat business, if customer loyalty is key, understanding the precise nature of churn is crucial.
This book goes beyond superficial data interpretation and guides you through how to fight 'disengagement' based on real data.
2.
Become a Real-World Powerhouse - How to Turn Data into "Useful Information"
This book goes beyond simple churn rate calculations and provides specific methods and know-how for converting all user behavior data within a service into behavioral metrics.
It also equips you with practical problem-solving skills through Python and SQL-centric code, clear quality assurance (QA) procedures, and a step-by-step approach to linking behavioral metrics and churn.
If you want to handle data properly, this book will teach you how to go beyond simply collecting a lot of data to find important signals and lead to practical analysis.
Moreover, the book's practitioner-focused explanations and extensive examples give readers the confidence that they can immediately apply the concepts to their own business.
3.
Data-driven warfare: Beyond predictions, focus on actionable change.
This book is dedicated to connecting data to strategy and real change.
It also presents a practical approach to integrating analysis results into actual business improvements, product/marketing/customer support policies.
This book goes beyond simple predictions to teach you how to strategically segment, target, and induce behavioral changes in your customers. It also provides insights into logistic regression, machine learning analysis, and how to wisely manage redundant data and information overload.
This is a practical weapon that I would highly recommend to those who know that repeat customers are their revenue, growth, and future.
If you're a reader who wants to overcome the inevitable challenge of customer churn with data and practical strategies, I urge you to pick up this book now.
◈ What this book covers ◈
◆ Calculating churn metrics
Identifying user behaviors that indicate abandonment
◆ Using a churn reduction strategy through customer segmentation
Applying attrition analysis techniques to other business areas
◆ Using AI for accurate churn prediction
◈ Target audience of this book ◈
The primary audience for this book is data scientists, data analysts, and machine learning engineers.
If you're responsible for understanding online products or services and preventing churn, this book will be a huge help.
This book is also ideal for students majoring in computer science and data science, or anyone who knows how to code and wants to learn more about the core areas of data science in a typical corporate setting.
This book starts with raw data and provides the background knowledge necessary for all analytical tasks covered, making it a perfect hands-on course in data science, taught through a small company's churn analysis project (sample datasets are also provided).
Chapters 8 and 9 of Part 3 of this book, which cover churn prediction and machine learning, may be a bit challenging for those without experience in the subject.
Even without this background, you can learn everything you need to know in Chapters 8 and 9, but you may need to invest additional time reading the recommended online materials.
This book is a must-read even for business professionals who don't code.
This book features unique case studies of churn from real-world companies, explaining the data commonly used in churn analysis, the practices used to turn that data into actionable intelligence, and the most common outcomes.
In particular, this book emphasizes how to effectively communicate data results to business managers, so all important key points are explained in layman's terms rather than in technical jargon.
So if you're interested in traversing but don't know how to code, I recommend skimming through the key points clearly outlined in this book and skipping the coding and math.
Then, it might be helpful to share this book with one of your developers and get help putting the concepts into practice.
◈ Structure of this book ◈
This book is divided into three main parts.
Part 1 explains what churn is, how to measure it, what data companies typically use to understand and reduce churn, and how to prepare to leverage that data effectively.
■ Chapter 1 provides a general introduction to the field and case studies, highlighting the types of insights this book can provide that will help you develop your own products and services.
■ Chapter 2 explains how to identify churn customers and measure churn using various methods. The SQL code appears from this chapter onward.
■ Chapter 3 introduces how to calculate customer metrics using user event data collected by most online businesses.
■ Chapter 4 explains how to combine the churn data from Chapter 2 and the metrics from Chapter 3 to create an analytics dataset to understand and combat churn.
Part 2, which contains the core techniques of this book, focuses on understanding how customer behavior relates to churn and retention and leveraging this knowledge to drive churn reduction strategies.
■ Chapter 5 describes a form of cohort analysis, a key method for understanding and explaining the relationship between behavior and attrition.
Chapter 5 also contains many case study examples, and the code is written in Python.
■ Chapter 6 looks at how to handle data that is too large to handle.
Most corporate datasets have closely related measurements that fundamentally represent the same behavior.
How we handle this redundant information is important.
■ Chapter 7 returns to the topic of creating metrics, using information from Chapters 5 and 6 to design advanced metrics that help explain complex customer behaviors such as price sensitivity and efficiency.
Part 3 covers prediction using regression and machine learning.
Predictions are less important than having good metrics when it comes to reducing churn, but they can be useful.
However, performing predictions properly requires some special techniques.
■ Chapter 8 explains how to predict customer churn probability through regression and how to interpret the prediction results, including calculating customer lifetime value.
■ Chapter 9 explains machine learning and accuracy measurement and optimization of churn prediction.
■ Chapter 10 covers analyzing demographic or firmographic data related to churn and finding lookalikes for your best customers.
Most readers should start from the beginning and read Parts 1 and 2.
After learning and applying these techniques, if you need to make predictions or find lookalike customers, continue reading Part 3.
If you're already using advanced analytics, you can skip Part 1 and start with Part 2 or Part 3.
For the purposes of this book, using advanced analytics means you already have good customer metrics and can identify and measure churn.
If not, start from Part 1.
Translator's Note
We're thrilled to bring you this book on data-driven churn prevention and customer retention strategies.
In Korea, it's not easy to find a deep, data-driven, and expert book on customer churn prevention, so the opportunity to translate this book was truly meaningful.
In recent years, many companies have focused on quantitative growth to maximize the acquisition of new customers.
However, in a market environment with increasing volatility, the importance of retention strategies that retain existing customers and maximize their lifetime value (LTV) is greater than ever.
Beyond simply acquiring customers, the key to sustainable growth is turning away customers and turning them into loyal customers.
This book is a practical guide that meets the needs of the times.
Rather than relying on guesswork or experience, we provide concrete methods for identifying the root causes of customer churn through data analysis and developing actionable strategies.
Written specifically from the perspective of those who handle data, it starts with handling raw data and goes beyond simply creating churn prediction models, focusing on discovering and utilizing customer metrics that can be directly "used" for the business.
It covers a variety of case studies applicable to subscription services, as well as any product or service with repeat customers, and practical techniques that emphasize statistical and computer science algorithms.
Another great advantage is that it is structured so that even readers without their own data can learn by following along by simulating datasets similar to real data.
Therefore, I highly recommend this book to anyone looking to improve their services and prevent churn based on data.
For data analysts, data scientists, marketers, and other practitioners already struggling to prevent attrition, we'll provide practical tools and tactics to transform your current efforts into more systematic and data-driven ones.
It will also serve as a ray of light for business leaders and those without much data knowledge who recognize that customer churn is a serious problem but feel overwhelmed by where to start.
This book provides deep insights into how data can contribute to business growth, particularly how data analytics can be applied to the challenging problem of churn.
I sincerely hope that this book will serve as valuable nurturing material for many Korean companies as they effectively address customer churn issues through data-driven approaches and achieve sustainable growth.
I sincerely hope that through this book, readers will win the fight against churn with data.
Breaking Through "Churning" - The Key to Unlocking the Secrets of Repeat Customers
Churn is a real problem that all companies providing products and services must face, and it is an indicator that determines the very survival of a business.
"Data-Driven Retention Strategy" breaks down the complex nature of why customers churn, how to define churn, and where to start measuring it.
Whether your business relies on subscriptions or regular repeat business, if customer loyalty is key, understanding the precise nature of churn is crucial.
This book goes beyond superficial data interpretation and guides you through how to fight 'disengagement' based on real data.
2.
Become a Real-World Powerhouse - How to Turn Data into "Useful Information"
This book goes beyond simple churn rate calculations and provides specific methods and know-how for converting all user behavior data within a service into behavioral metrics.
It also equips you with practical problem-solving skills through Python and SQL-centric code, clear quality assurance (QA) procedures, and a step-by-step approach to linking behavioral metrics and churn.
If you want to handle data properly, this book will teach you how to go beyond simply collecting a lot of data to find important signals and lead to practical analysis.
Moreover, the book's practitioner-focused explanations and extensive examples give readers the confidence that they can immediately apply the concepts to their own business.
3.
Data-driven warfare: Beyond predictions, focus on actionable change.
This book is dedicated to connecting data to strategy and real change.
It also presents a practical approach to integrating analysis results into actual business improvements, product/marketing/customer support policies.
This book goes beyond simple predictions to teach you how to strategically segment, target, and induce behavioral changes in your customers. It also provides insights into logistic regression, machine learning analysis, and how to wisely manage redundant data and information overload.
This is a practical weapon that I would highly recommend to those who know that repeat customers are their revenue, growth, and future.
If you're a reader who wants to overcome the inevitable challenge of customer churn with data and practical strategies, I urge you to pick up this book now.
◈ What this book covers ◈
◆ Calculating churn metrics
Identifying user behaviors that indicate abandonment
◆ Using a churn reduction strategy through customer segmentation
Applying attrition analysis techniques to other business areas
◆ Using AI for accurate churn prediction
◈ Target audience of this book ◈
The primary audience for this book is data scientists, data analysts, and machine learning engineers.
If you're responsible for understanding online products or services and preventing churn, this book will be a huge help.
This book is also ideal for students majoring in computer science and data science, or anyone who knows how to code and wants to learn more about the core areas of data science in a typical corporate setting.
This book starts with raw data and provides the background knowledge necessary for all analytical tasks covered, making it a perfect hands-on course in data science, taught through a small company's churn analysis project (sample datasets are also provided).
Chapters 8 and 9 of Part 3 of this book, which cover churn prediction and machine learning, may be a bit challenging for those without experience in the subject.
Even without this background, you can learn everything you need to know in Chapters 8 and 9, but you may need to invest additional time reading the recommended online materials.
This book is a must-read even for business professionals who don't code.
This book features unique case studies of churn from real-world companies, explaining the data commonly used in churn analysis, the practices used to turn that data into actionable intelligence, and the most common outcomes.
In particular, this book emphasizes how to effectively communicate data results to business managers, so all important key points are explained in layman's terms rather than in technical jargon.
So if you're interested in traversing but don't know how to code, I recommend skimming through the key points clearly outlined in this book and skipping the coding and math.
Then, it might be helpful to share this book with one of your developers and get help putting the concepts into practice.
◈ Structure of this book ◈
This book is divided into three main parts.
Part 1 explains what churn is, how to measure it, what data companies typically use to understand and reduce churn, and how to prepare to leverage that data effectively.
■ Chapter 1 provides a general introduction to the field and case studies, highlighting the types of insights this book can provide that will help you develop your own products and services.
■ Chapter 2 explains how to identify churn customers and measure churn using various methods. The SQL code appears from this chapter onward.
■ Chapter 3 introduces how to calculate customer metrics using user event data collected by most online businesses.
■ Chapter 4 explains how to combine the churn data from Chapter 2 and the metrics from Chapter 3 to create an analytics dataset to understand and combat churn.
Part 2, which contains the core techniques of this book, focuses on understanding how customer behavior relates to churn and retention and leveraging this knowledge to drive churn reduction strategies.
■ Chapter 5 describes a form of cohort analysis, a key method for understanding and explaining the relationship between behavior and attrition.
Chapter 5 also contains many case study examples, and the code is written in Python.
■ Chapter 6 looks at how to handle data that is too large to handle.
Most corporate datasets have closely related measurements that fundamentally represent the same behavior.
How we handle this redundant information is important.
■ Chapter 7 returns to the topic of creating metrics, using information from Chapters 5 and 6 to design advanced metrics that help explain complex customer behaviors such as price sensitivity and efficiency.
Part 3 covers prediction using regression and machine learning.
Predictions are less important than having good metrics when it comes to reducing churn, but they can be useful.
However, performing predictions properly requires some special techniques.
■ Chapter 8 explains how to predict customer churn probability through regression and how to interpret the prediction results, including calculating customer lifetime value.
■ Chapter 9 explains machine learning and accuracy measurement and optimization of churn prediction.
■ Chapter 10 covers analyzing demographic or firmographic data related to churn and finding lookalikes for your best customers.
Most readers should start from the beginning and read Parts 1 and 2.
After learning and applying these techniques, if you need to make predictions or find lookalike customers, continue reading Part 3.
If you're already using advanced analytics, you can skip Part 1 and start with Part 2 or Part 3.
For the purposes of this book, using advanced analytics means you already have good customer metrics and can identify and measure churn.
If not, start from Part 1.
Translator's Note
We're thrilled to bring you this book on data-driven churn prevention and customer retention strategies.
In Korea, it's not easy to find a deep, data-driven, and expert book on customer churn prevention, so the opportunity to translate this book was truly meaningful.
In recent years, many companies have focused on quantitative growth to maximize the acquisition of new customers.
However, in a market environment with increasing volatility, the importance of retention strategies that retain existing customers and maximize their lifetime value (LTV) is greater than ever.
Beyond simply acquiring customers, the key to sustainable growth is turning away customers and turning them into loyal customers.
This book is a practical guide that meets the needs of the times.
Rather than relying on guesswork or experience, we provide concrete methods for identifying the root causes of customer churn through data analysis and developing actionable strategies.
Written specifically from the perspective of those who handle data, it starts with handling raw data and goes beyond simply creating churn prediction models, focusing on discovering and utilizing customer metrics that can be directly "used" for the business.
It covers a variety of case studies applicable to subscription services, as well as any product or service with repeat customers, and practical techniques that emphasize statistical and computer science algorithms.
Another great advantage is that it is structured so that even readers without their own data can learn by following along by simulating datasets similar to real data.
Therefore, I highly recommend this book to anyone looking to improve their services and prevent churn based on data.
For data analysts, data scientists, marketers, and other practitioners already struggling to prevent attrition, we'll provide practical tools and tactics to transform your current efforts into more systematic and data-driven ones.
It will also serve as a ray of light for business leaders and those without much data knowledge who recognize that customer churn is a serious problem but feel overwhelmed by where to start.
This book provides deep insights into how data can contribute to business growth, particularly how data analytics can be applied to the challenging problem of churn.
I sincerely hope that this book will serve as valuable nurturing material for many Korean companies as they effectively address customer churn issues through data-driven approaches and achieve sustainable growth.
I sincerely hope that through this book, readers will win the fight against churn with data.
GOODS SPECIFICS
- Date of issue: July 21, 2025
- Page count, weight, size: 572 pages | 1,066g | 188*235*27mm
- ISBN13: 9791161759937
- ISBN10: 116175993X
You may also like
카테고리
korean


korean

![GQ KOREA Mark (Monthly): December [2025]](http://librairie.coreenne.fr/cdn/shop/files/8ef265dbbfbf186523ed75ba7319009d.jpg?v=1765340328&width=3840)


