

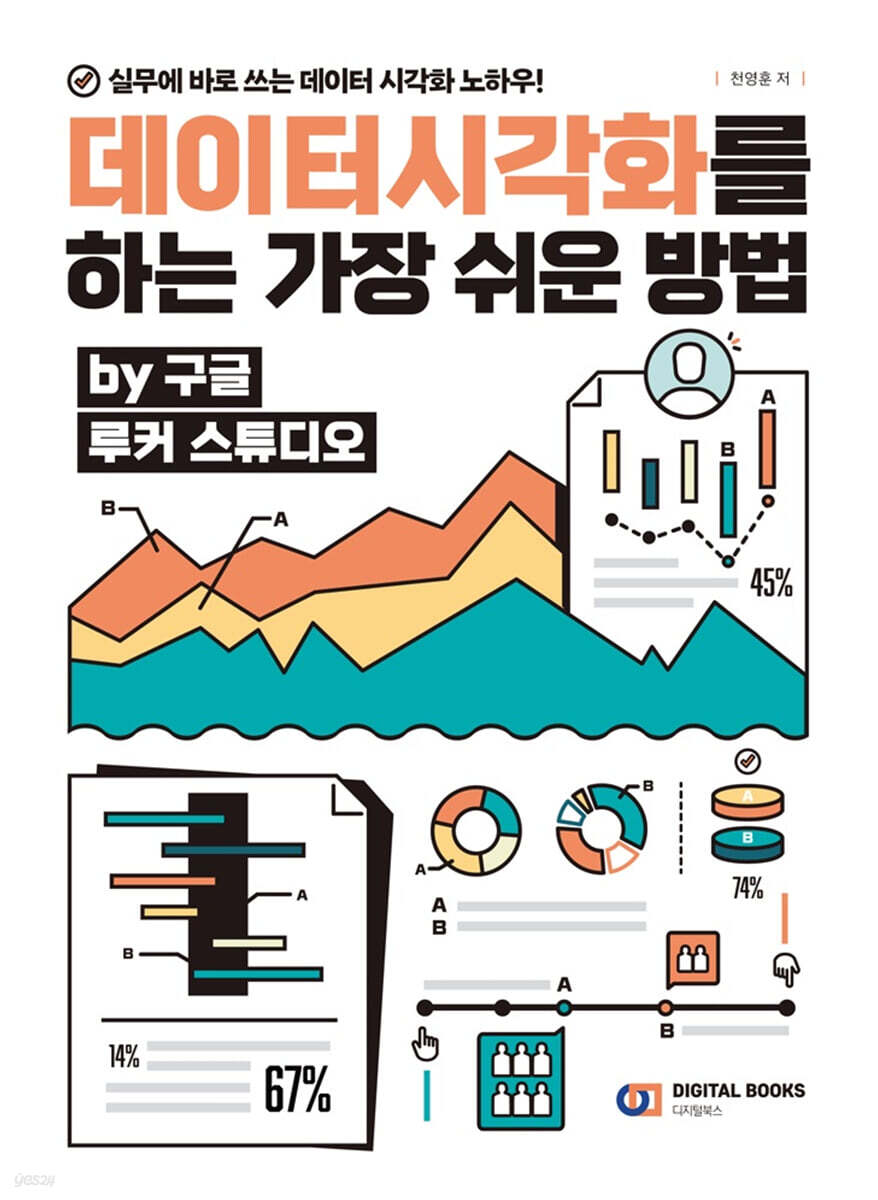
The Easiest Way to Visualize Data with Google Looker Studio
 |
Description
Book Introduction
Korea's first practical guide to Google Looker Studio!
The Easiest Way to Master Data Visualization Tools in 3 Parts
AARRR analysis using GA4 data!
The easiest way to visualize data!
As digital marketing becomes more sophisticated, various advertising tools and methods for improving advertising effectiveness are continuously emerging.
There are many data visualization tools available, such as Power BI and Tableau, but the easiest and fastest to learn is Google Looker Studio.
『The Easiest Way to Visualize Data by Google Looker Studio』 by author Younghoon Cheon, who teaches marketing at the marketing community 'iBoss', is divided into three parts to explain the author's know-how and how to use Google Looker Studio, so that even beginners with no prior knowledge can easily learn it.
We provide practice data for each part, and explain how to effectively convey the functions of Google Looker Studio, various charts, and accurate data while ensuring readability by utilizing different data for each part.
Additionally, through AARRR analysis, marketers who are already using Google Analytics 4 are also presented with a method to visualize Google Analytics 4 data using Google Looker Studio.
The Easiest Way to Master Data Visualization Tools in 3 Parts
AARRR analysis using GA4 data!
The easiest way to visualize data!
As digital marketing becomes more sophisticated, various advertising tools and methods for improving advertising effectiveness are continuously emerging.
There are many data visualization tools available, such as Power BI and Tableau, but the easiest and fastest to learn is Google Looker Studio.
『The Easiest Way to Visualize Data by Google Looker Studio』 by author Younghoon Cheon, who teaches marketing at the marketing community 'iBoss', is divided into three parts to explain the author's know-how and how to use Google Looker Studio, so that even beginners with no prior knowledge can easily learn it.
We provide practice data for each part, and explain how to effectively convey the functions of Google Looker Studio, various charts, and accurate data while ensuring readability by utilizing different data for each part.
Additionally, through AARRR analysis, marketers who are already using Google Analytics 4 are also presented with a method to visualize Google Analytics 4 data using Google Looker Studio.
- You can preview some of the book's contents.
Preview
index
PART 01 Data Visualization
CHAPTER 01.
Data visualization using Google Looker Studio
■ A or B, that is the question
■ Introducing Google Looker Studio
■ Connect - Visualize - Share
■ Measurement criteria vs. measurement items
CHAPTER 02.
Creating a report card
■ STEP 1: Connection
■ STEP 2: Visualization
■ Be careful to distinguish between measurement items and measurement criteria
■ Completed transcript and key fields
■ STEP 3: Sharing
■ Don't memorize it.
Just for reference.
■ Refresh vs. Reconnect Data
■ Summary of basic information
PART 02 Store Report
CHAPTER 01.
connection
■ Scenario
■ Easier! Using templates
■ Create a copy of a report using a template
■ Data connection
CHAPTER 02.
Visualization: Layout Configuration
■ Logo and Link
■ Layout Wizard Text
CHAPTER 03.
Visualization: Dynamic Filters
■ Date filter
■ Various filters
CHAPTER 04.
Visualization: Scorecard
■ Key points at a glance
■ Mass production of charts
■ User-defined functions
CHAPTER 05.
Visualization: Time Series Chart
■ Check the trend
CHAPTER 06.
Visualization: Pie Chart
■ Ratio comparison
CHAPTER 07.
Visualization: Bar Chart
■ Value comparison
CHAPTER 08.
Visualization: Time Series Cumulative Chart
■ Accumulation of trends
CHAPTER 09.
Visualization: Add Page
■ Add page
■ Control Copy
CHAPTER 10.
Visualization: Table
■ Overcoming the worst readability
CHAPTER 11.
Visualization: 100% Stacked Area Chart
■ Trend of ratio
CHAPTER 12.
Visualization: Stacked Column Chart
■ Detailed analysis of values
CHAPTER 13.
Visualization: Pivot Tables vs. Scatter Charts
■ Pivot Table: A Chart Master's Measure
■ The opposite of a pivot table, a scatter chart
■ Various other charts
CHAPTER 14.
share
■ Sharing and Reservation
CHAPTER 15.
More Charts, More Features - Nth Learning
■ Two or more different data sources
■ Managing added data sources
■ Copy the completed report
■ Excel linkage
■ BigQuery integration
■ Google Sheets data preprocessing
■ PARSE_DATE function
■ Importing Google Sheet data range
■ Interrelationships between charts
■ Extension of pivot tables
■ Creating charts with ChatGPT
PART 03 AARRR Report Using Google Analytics 4 Data
CHAPTER 01.
AARRR for Marketers Only
■ AARRR Analysis
■ Origin
■ Improvement
■ Scenario
■ Your own account vs. Google demo account
■ Create a copy of the AARRR template
■ Data connection
CHAPTER 02. ACQUISITION
■ Period Control
■ Comparison of number of connections by inflow
■ Number of incoming sessions
■ Number of active users
■ Ratio by inflow device
■ Inflow area
CHAPTER 03. ACTIVATION
■ Engagement and Conversion Data
■ Popular Pages
■ Session and participation trends
CHAPTER 04. RETENTION (Revisit Data)
■ New/Returning User Ratio
■ Number of returning visitor sessions
■ Returning visitor participation rate
■ Returning visitors' dwell time and conversion data
CHAPTER 05. REVENUE
■ Sales per user (add calculated field)
■ Performance by inflow: Table
■ Performance ratio by inflow source/medium: Donut chart
CHAPTER 06. REFERRAL (referral + organic)
■ Number of recommended inflow sessions
■ Referral Inflow Participation Rate
■ Recommended inflow dwell time and conversion rate
■ Recommended inflow conversion analysis
CHAPTER 07.
Share and more
■ Share
■ 3D interpretation of the AARRR report
■ Demo Account AARRR Complete Version - Create a Copy
■ It's not the end, it's the beginning
CHAPTER 01.
Data visualization using Google Looker Studio
■ A or B, that is the question
■ Introducing Google Looker Studio
■ Connect - Visualize - Share
■ Measurement criteria vs. measurement items
CHAPTER 02.
Creating a report card
■ STEP 1: Connection
■ STEP 2: Visualization
■ Be careful to distinguish between measurement items and measurement criteria
■ Completed transcript and key fields
■ STEP 3: Sharing
■ Don't memorize it.
Just for reference.
■ Refresh vs. Reconnect Data
■ Summary of basic information
PART 02 Store Report
CHAPTER 01.
connection
■ Scenario
■ Easier! Using templates
■ Create a copy of a report using a template
■ Data connection
CHAPTER 02.
Visualization: Layout Configuration
■ Logo and Link
■ Layout Wizard Text
CHAPTER 03.
Visualization: Dynamic Filters
■ Date filter
■ Various filters
CHAPTER 04.
Visualization: Scorecard
■ Key points at a glance
■ Mass production of charts
■ User-defined functions
CHAPTER 05.
Visualization: Time Series Chart
■ Check the trend
CHAPTER 06.
Visualization: Pie Chart
■ Ratio comparison
CHAPTER 07.
Visualization: Bar Chart
■ Value comparison
CHAPTER 08.
Visualization: Time Series Cumulative Chart
■ Accumulation of trends
CHAPTER 09.
Visualization: Add Page
■ Add page
■ Control Copy
CHAPTER 10.
Visualization: Table
■ Overcoming the worst readability
CHAPTER 11.
Visualization: 100% Stacked Area Chart
■ Trend of ratio
CHAPTER 12.
Visualization: Stacked Column Chart
■ Detailed analysis of values
CHAPTER 13.
Visualization: Pivot Tables vs. Scatter Charts
■ Pivot Table: A Chart Master's Measure
■ The opposite of a pivot table, a scatter chart
■ Various other charts
CHAPTER 14.
share
■ Sharing and Reservation
CHAPTER 15.
More Charts, More Features - Nth Learning
■ Two or more different data sources
■ Managing added data sources
■ Copy the completed report
■ Excel linkage
■ BigQuery integration
■ Google Sheets data preprocessing
■ PARSE_DATE function
■ Importing Google Sheet data range
■ Interrelationships between charts
■ Extension of pivot tables
■ Creating charts with ChatGPT
PART 03 AARRR Report Using Google Analytics 4 Data
CHAPTER 01.
AARRR for Marketers Only
■ AARRR Analysis
■ Origin
■ Improvement
■ Scenario
■ Your own account vs. Google demo account
■ Create a copy of the AARRR template
■ Data connection
CHAPTER 02. ACQUISITION
■ Period Control
■ Comparison of number of connections by inflow
■ Number of incoming sessions
■ Number of active users
■ Ratio by inflow device
■ Inflow area
CHAPTER 03. ACTIVATION
■ Engagement and Conversion Data
■ Popular Pages
■ Session and participation trends
CHAPTER 04. RETENTION (Revisit Data)
■ New/Returning User Ratio
■ Number of returning visitor sessions
■ Returning visitor participation rate
■ Returning visitors' dwell time and conversion data
CHAPTER 05. REVENUE
■ Sales per user (add calculated field)
■ Performance by inflow: Table
■ Performance ratio by inflow source/medium: Donut chart
CHAPTER 06. REFERRAL (referral + organic)
■ Number of recommended inflow sessions
■ Referral Inflow Participation Rate
■ Recommended inflow dwell time and conversion rate
■ Recommended inflow conversion analysis
CHAPTER 07.
Share and more
■ Share
■ 3D interpretation of the AARRR report
■ Demo Account AARRR Complete Version - Create a Copy
■ It's not the end, it's the beginning
Publisher's Review
Learn the features of Google Looker Studio through friendly explanations for readers new to Google Looker Studio and hands-on data visualization exercises using examples provided for each part.
Plus, the author's expertise in data visualization and tips for creating tables that are easy to read at a glance.
It is structured so that you can acquire all the features of Google Looker Studio just by reading the book.
PART 01 Data Visualization
We explain the necessity of data visualization and the features you need to know when visualizing data using Google Looker Studio.
You can take your first steps in data visualization by practicing with prepared “report card” data.
PART 02 Store Report
This explains the various charts available in Google Looker Studio and the characteristics of each chart.
We also introduce how to create readable reports by utilizing charts that fit the practical situation and purpose.
You can acquire the skills necessary for practical work through the “Store Report,” which is prepared practice data.
PART 03 AARRR Report Using Google Analytics 4 Data
PART 03 Google Analytics 4 Data Utilization AARRR Report is intended for marketers familiar with data visualization tools and data analysis tools, as well as readers who have completed PART 01 and 02.
This course covers creating AARRR reports with Google Looker Studio, and how to take it a step further by leveraging a demo account and practice templates from Google Analytics 4.
+ Level up your practice with free YouTube video lectures!
Lecture videos are provided through the author's YouTube channel.
You can learn more about the book's explanations and the content you need to study data visualization through the author's YouTube videos.
What kind of readers is this book for?
● Those who want to learn data visualization
● People who prefer tools that can be learned and used right away
● Those who want to shorten work hours to be more efficient
Plus, the author's expertise in data visualization and tips for creating tables that are easy to read at a glance.
It is structured so that you can acquire all the features of Google Looker Studio just by reading the book.
PART 01 Data Visualization
We explain the necessity of data visualization and the features you need to know when visualizing data using Google Looker Studio.
You can take your first steps in data visualization by practicing with prepared “report card” data.
PART 02 Store Report
This explains the various charts available in Google Looker Studio and the characteristics of each chart.
We also introduce how to create readable reports by utilizing charts that fit the practical situation and purpose.
You can acquire the skills necessary for practical work through the “Store Report,” which is prepared practice data.
PART 03 AARRR Report Using Google Analytics 4 Data
PART 03 Google Analytics 4 Data Utilization AARRR Report is intended for marketers familiar with data visualization tools and data analysis tools, as well as readers who have completed PART 01 and 02.
This course covers creating AARRR reports with Google Looker Studio, and how to take it a step further by leveraging a demo account and practice templates from Google Analytics 4.
+ Level up your practice with free YouTube video lectures!
Lecture videos are provided through the author's YouTube channel.
You can learn more about the book's explanations and the content you need to study data visualization through the author's YouTube videos.
What kind of readers is this book for?
● Those who want to learn data visualization
● People who prefer tools that can be learned and used right away
● Those who want to shorten work hours to be more efficient
GOODS SPECIFICS
- Date of issue: December 10, 2024
- Page count, weight, size: 232 pages | 614g | 188*257*11mm
- ISBN13: 9788960884717
- ISBN10: 8960884715
You may also like
카테고리
korean


korean

![GQ KOREA Mark (Monthly): December [2025]](http://librairie.coreenne.fr/cdn/shop/files/8ef265dbbfbf186523ed75ba7319009d.jpg?v=1765340328&width=3840)


