

StatQuest Machine Learning with Pictures
 |
Description
Book Introduction
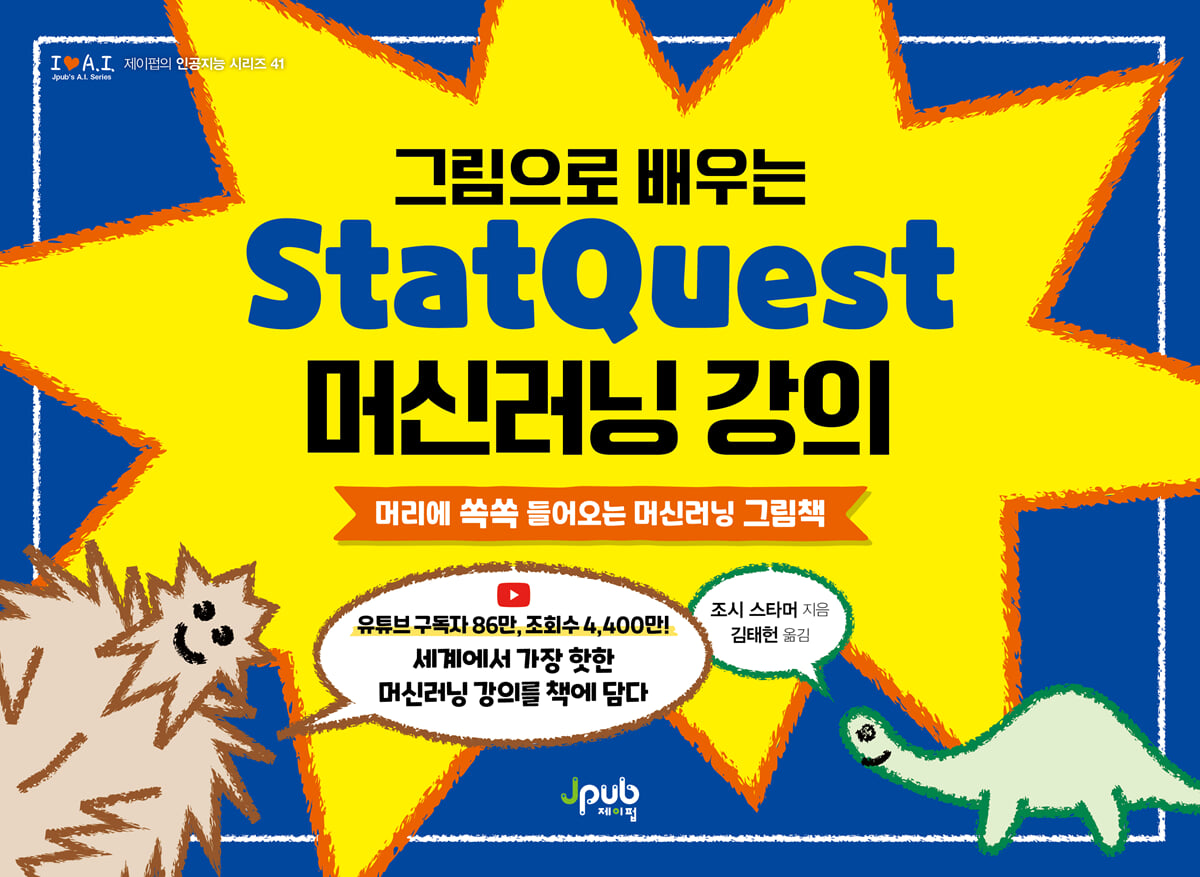
There has never been a more visual and intuitive machine learning course.
Machine learning is a fascinating and powerful field, but it's also incredibly complex.
This book breaks down complex machine learning algorithms into easy-to-understand chunks and presents them with intuitive examples and diagrams.
Instead of summarizing concepts in words, we explain them in an innovative StatQuest way, making it easy to understand what machine learning is and what its goals are.
Let's build the foundation of machine learning with a visual learning method that explains one picture per page.
Machine learning is a fascinating and powerful field, but it's also incredibly complex.
This book breaks down complex machine learning algorithms into easy-to-understand chunks and presents them with intuitive examples and diagrams.
Instead of summarizing concepts in words, we explain them in an innovative StatQuest way, making it easy to understand what machine learning is and what its goals are.
Let's build the foundation of machine learning with a visual learning method that explains one picture per page.
- You can preview some of the book's contents.
Preview
index
About the Author and Translator 3
Translator's Preface 4
Beta Reader Review 5
How to Read This Book 9
CHAPTER 1: Basic Machine Learning Concepts!!! 10
CHAPTER 2 CROSS-VALIDATION!!! 23
CHAPTER 3: Basic Statistics Concepts!!! 32
CHAPTER 4: LINEAR REGRESSION!!! 77
CHAPTER 5: Gradient Descent!!! 85
CHAPTER 6: Logistic Regression!!! 110
CHAPTER 7 Naive Bayes!!! 122
CHAPTER 8 Evaluating Model Performance!!! 138
CHAPTER 9: Preventing Overfitting with Regularization!!! 166
CHAPTER 10: Decision Trees!!! 185
CHAPTER 11: Support Vector Classifiers and Support Vector Machines (SVMs)!!! 220
CHAPTER 12 NEURAL NETWORKS!!! 236
Appendix (something you probably learned in school but have now forgotten)!!! 273
Acknowledgments 304
Search 306
Translator's Preface 4
Beta Reader Review 5
How to Read This Book 9
CHAPTER 1: Basic Machine Learning Concepts!!! 10
CHAPTER 2 CROSS-VALIDATION!!! 23
CHAPTER 3: Basic Statistics Concepts!!! 32
CHAPTER 4: LINEAR REGRESSION!!! 77
CHAPTER 5: Gradient Descent!!! 85
CHAPTER 6: Logistic Regression!!! 110
CHAPTER 7 Naive Bayes!!! 122
CHAPTER 8 Evaluating Model Performance!!! 138
CHAPTER 9: Preventing Overfitting with Regularization!!! 166
CHAPTER 10: Decision Trees!!! 185
CHAPTER 11: Support Vector Classifiers and Support Vector Machines (SVMs)!!! 220
CHAPTER 12 NEURAL NETWORKS!!! 236
Appendix (something you probably learned in school but have now forgotten)!!! 273
Acknowledgments 304
Search 306
Detailed image

Into the book
Problem: As we will learn later, there are various methods in machine learning for classification or quantitative prediction.
So how do we choose which method to use? For example, let's say we're using this black line to predict height from weight.
Or let's say we want to predict height based on weight with this squiggly green curve.
Should I use the black straight line or the squiggly green curve? Answer: In machine learning, deciding which method to use typically means trying it out and seeing how well it performs.
For example, if this person weighs this much… the black line will predict that this person is this much taller.
Conversely, the squiggly green curve predicts that this person will be slightly taller.
--- p.14
There are many machine learning methods that look cool, like deep learning convolutional neural networks.
And every year, many new and interesting methods are released.
But no matter which method you use, the most important thing is that it must perform well on test data. BAM!!! Now that we've covered some key machine learning concepts, let's dive into some fancy machine learning terminology.
If you remember it well, you will look smart when you attend the dance party.
--- p.19
Previously, we looked at how the binomial distribution calculates the probability of a series of binary outcomes, such as the probability that two out of three people prefer pumpkin pie.
However, there are many other discrete probability distributions that are used in various situations.
For example, if you can read 10 pages of this book in an hour on average, you can use the Poisson distribution to calculate the probability that you will read 8 pages in the next hour.
--- p.48
ROC stands for receiver operating characteristic.
This name derives from a graph used to accurately identify fighter jet signals from radar signals received during World War II. ROC graphs are extremely helpful when trying to find good classification thresholds because they summarize at a glance how well each threshold performs in terms of the true positive rate and false positive rate.
--- p.154
Let's say we create two models, logistic regression and naive Bayes, and test them on the same data.
We want to know which model performs better.
In theory, we could compare the ROC graphs of each model.
If we only have two models to compare, this might be a good option.
--- p.160
Problem: Like linear regression, neural networks have parameters that must be optimized to fit a squiggly curve or curved line to the data.
How can we find the optimal values for these parameters? Answer: Like linear regression, we can use gradient descent or stochastic gradient descent to find the optimal parameter values.
But we won't call it gradient descent.
Then it would be too easy.
We'll call this backpropagation, which comes from the method of finding the derivatives of each parameter in a neural network (going backwards and forwards). BAM!!!
So how do we choose which method to use? For example, let's say we're using this black line to predict height from weight.
Or let's say we want to predict height based on weight with this squiggly green curve.
Should I use the black straight line or the squiggly green curve? Answer: In machine learning, deciding which method to use typically means trying it out and seeing how well it performs.
For example, if this person weighs this much… the black line will predict that this person is this much taller.
Conversely, the squiggly green curve predicts that this person will be slightly taller.
--- p.14
There are many machine learning methods that look cool, like deep learning convolutional neural networks.
And every year, many new and interesting methods are released.
But no matter which method you use, the most important thing is that it must perform well on test data. BAM!!! Now that we've covered some key machine learning concepts, let's dive into some fancy machine learning terminology.
If you remember it well, you will look smart when you attend the dance party.
--- p.19
Previously, we looked at how the binomial distribution calculates the probability of a series of binary outcomes, such as the probability that two out of three people prefer pumpkin pie.
However, there are many other discrete probability distributions that are used in various situations.
For example, if you can read 10 pages of this book in an hour on average, you can use the Poisson distribution to calculate the probability that you will read 8 pages in the next hour.
--- p.48
ROC stands for receiver operating characteristic.
This name derives from a graph used to accurately identify fighter jet signals from radar signals received during World War II. ROC graphs are extremely helpful when trying to find good classification thresholds because they summarize at a glance how well each threshold performs in terms of the true positive rate and false positive rate.
--- p.154
Let's say we create two models, logistic regression and naive Bayes, and test them on the same data.
We want to know which model performs better.
In theory, we could compare the ROC graphs of each model.
If we only have two models to compare, this might be a good option.
--- p.160
Problem: Like linear regression, neural networks have parameters that must be optimized to fit a squiggly curve or curved line to the data.
How can we find the optimal values for these parameters? Answer: Like linear regression, we can use gradient descent or stochastic gradient descent to find the optimal parameter values.
But we won't call it gradient descent.
Then it would be too easy.
We'll call this backpropagation, which comes from the method of finding the derivatives of each parameter in a neural network (going backwards and forwards). BAM!!!
--- p.255
Publisher's Review
An innovative way to understand machine learning more easily than a summary.
I want to clearly understand the concepts and terminology of machine learning that I am encountering for the first time.
But just looking at a thick machine learning book gives me a headache, so I don't readily pick it up.
Let's put those books aside for now.
By following the illustrations and fun examples in this book, you can easily and surely learn the fundamentals of machine learning.
Is there a better book for an introduction to machine learning?
Even those who know nothing about machine learning will quickly understand it if they immerse themselves in the content and read it.
The author's humor, clear answers, and helpful guides like Normalsaurus and Statsquatch guide you from the very basics to advanced topics like neural networks.
Instead of summarizing concepts in words, author Josh Starmer created the innovative StatQuest method, which has helped people around the world win data science competitions, pass exams, graduate from school, and get jobs and promotions.
I sincerely hope that you, the readers, will be one of them.
I'll conclude this review with a quote from a beta reader.
“I hope that from now on, there will be no one who does not know this book.”
Key Contents
■ Machine Learning Basics!!!
■ Cross validation!!!
■ Basic statistical concepts!!!
■ Linear regression!!!
■ Gradient descent!!!
■ Logistic regression!!!
■ Naive Bayes!!!
■ Evaluate model performance!!!
■ Prevent overfitting with regularization!!!
■ Decision tree!!!
■ Support Vector Classifier and Support Vector Machine!!!
■ Neural network!!!
I want to clearly understand the concepts and terminology of machine learning that I am encountering for the first time.
But just looking at a thick machine learning book gives me a headache, so I don't readily pick it up.
Let's put those books aside for now.
By following the illustrations and fun examples in this book, you can easily and surely learn the fundamentals of machine learning.
Is there a better book for an introduction to machine learning?
Even those who know nothing about machine learning will quickly understand it if they immerse themselves in the content and read it.
The author's humor, clear answers, and helpful guides like Normalsaurus and Statsquatch guide you from the very basics to advanced topics like neural networks.
Instead of summarizing concepts in words, author Josh Starmer created the innovative StatQuest method, which has helped people around the world win data science competitions, pass exams, graduate from school, and get jobs and promotions.
I sincerely hope that you, the readers, will be one of them.
I'll conclude this review with a quote from a beta reader.
“I hope that from now on, there will be no one who does not know this book.”
Key Contents
■ Machine Learning Basics!!!
■ Cross validation!!!
■ Basic statistical concepts!!!
■ Linear regression!!!
■ Gradient descent!!!
■ Logistic regression!!!
■ Naive Bayes!!!
■ Evaluate model performance!!!
■ Prevent overfitting with regularization!!!
■ Decision tree!!!
■ Support Vector Classifier and Support Vector Machine!!!
■ Neural network!!!
GOODS SPECIFICS
- Date of issue: February 16, 2023
- Page count, weight, size: 308 pages | 798g | 257*188*15mm
- ISBN13: 9791192469805
- ISBN10: 1192469801
You may also like
카테고리
korean


korean

![GQ KOREA Mark (Monthly): December [2025]](http://librairie.coreenne.fr/cdn/shop/files/8ef265dbbfbf186523ed75ba7319009d.jpg?v=1765340328&width=3840)


