

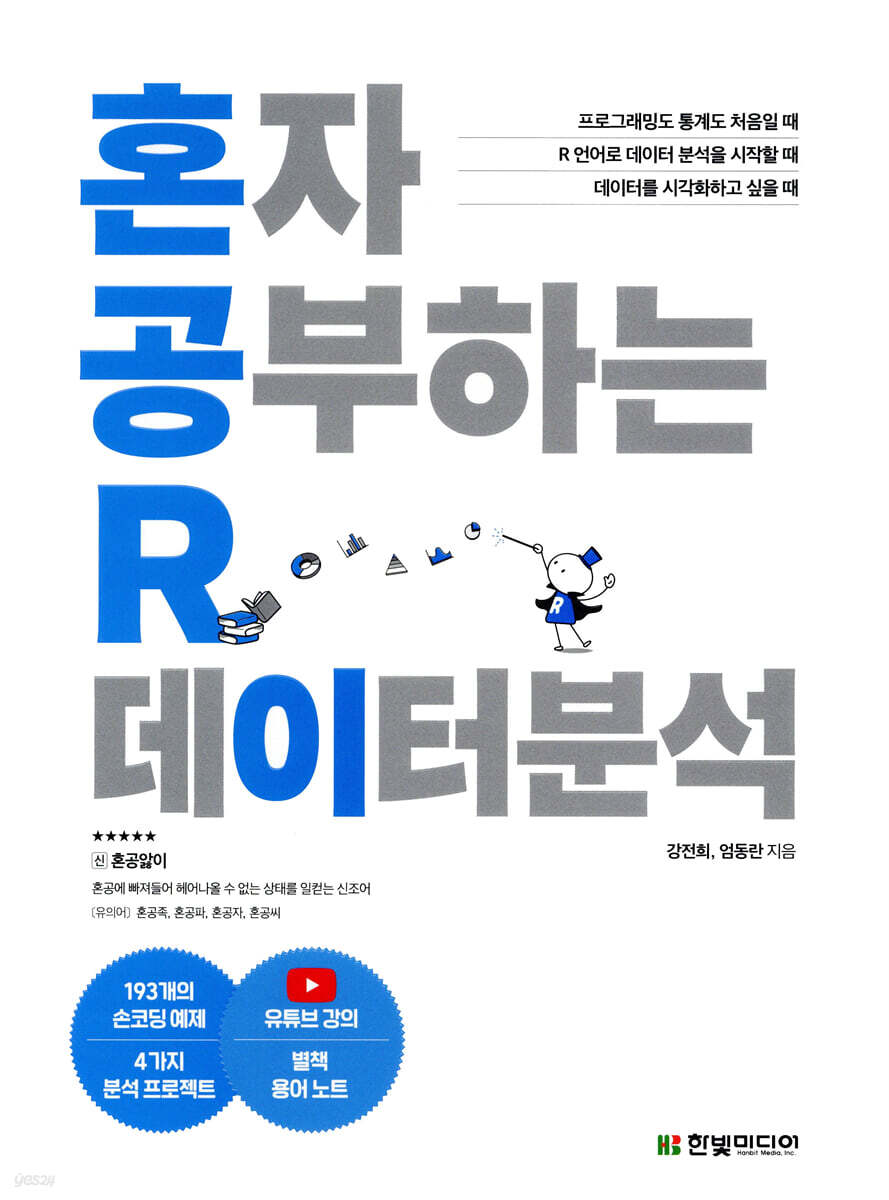
Self-study R data analysis
 |
Description
Book Introduction
Self-study is enough! Learn R data analysis with a one-on-one tutoring tutorial.
This book is designed to help beginners learning R data analysis on their own learn the essentials.
It considers the vague minds of beginners who don't even know 'what' or 'how' to learn, and kindly, like a private tutor, but only points out the essential content.
From the moment you open the book to the last page, you'll feel confident and assured that you can learn data analysis on your own!
Verified by 30 beta readers, this is a customized book for beginners that was 'created together', and was composed with 30 beta readers to actively reflect the difficulty level, length, and learning elements that are suitable for beginners.
Difficult terms and concepts are explained again, and complex explanations are explained with easy-to-see pictures.
The greatest strength of this book is that the beginner's perspective and perspective of many beginners who have 'studied on their own' are reflected throughout the book.
This book is designed to help beginners learning R data analysis on their own learn the essentials.
It considers the vague minds of beginners who don't even know 'what' or 'how' to learn, and kindly, like a private tutor, but only points out the essential content.
From the moment you open the book to the last page, you'll feel confident and assured that you can learn data analysis on your own!
Verified by 30 beta readers, this is a customized book for beginners that was 'created together', and was composed with 30 beta readers to actively reflect the difficulty level, length, and learning elements that are suitable for beginners.
Difficult terms and concepts are explained again, and complex explanations are explained with easy-to-see pictures.
The greatest strength of this book is that the beginner's perspective and perspective of many beginners who have 'studied on their own' are reflected throughout the book.
- You can preview some of the book's contents.
Preview
index
Chapter 01 Big Data and R
: Introduce the R language and learn why it is used in data analysis.
01-1 Big Data and the R Language
__The era of big data
Introducing the __R language
Pros and Cons of __R
[Key points summarized in three keywords]
[Confirmation question]
01-2 Development Environment Installation
Download the __R installation file
Installing __R
Running __R
__Download the R Studio installation file
Installing __R Studio
[Learn more] R Studio Cloud
[Key points summarized in four keywords]
[Confirmation question]
01-3 R Studio Interface and Environment Settings
__R Studio interface
__Settings
__Setting up the required working environment
__Create and save a script
__Run the code
[Learn more] Using Help
[Key Points Summarized in 5 Keywords]
[Confirmation question]
Chapter 02: Laying the Groundwork for Data Analysis
: Learn about the data analysis process and what data is.
02-1 Data Analysis Process
Step 1: Designing the Data Analysis
Step 2: Prepare the data
Step 3: Processing the Data
Step 4: Analyzing the Data
Step 5: Draw conclusions
[Key Points Summarized in 5 Keywords]
[Confirmation question]
02-2 Appearance of data
__Relationships between data structures and data types
__vector
__Categorical data
__Matrix and Array
__Lists and Data Frames
[Key Points Organized into 6 Keywords]
[Confirmation question]
Chapter 03 Learning R Programming
: Learn the basic syntax of R programming.
03-1 Variables and Functions
__Create a variable
__Calling a function
__Using built-in functions
__Creating a custom function
Why use the __return( ) function?
[Key Points Summarized in 5 Keywords]
[Confirmation question]
Package 03-2
Installing the __package
__Check installed packages
__Loading the package
__Delete package
__Using the main package
[Learn more] Find the package you need
[Key points summarized in four keywords]
[Key functions summarized in a table]
[Confirmation question]
03-3 Conditional statements and loops
__operator
__if-else conditional statement
__loop
[Learn More] Troubleshooting R Code Errors
[Key Points Organized into 6 Keywords]
[Key functions summarized in a table]
[Confirmation question]
Chapter 04 Handling Data
: Learn how to collect, observe, and explore data to understand its characteristics.
04-1 Collecting Data
__Enter data directly
__Import external data: TXT file
__Import external data: CSV files
__Import external data: Excel file
__Import external data: XML, JSON files
[Key points summarized in four keywords]
[Key functions summarized in a table]
[Confirmation question]
04-2 Observing Data
__Check all data
__Check the data summary
__Check descriptive statistics
__Analyzing data frequency
[Key Points Organized into 6 Keywords]
[Key functions summarized in a table]
[Confirmation question]
04-3 Exploring Data
__Drawing a bar graph
__Drawing a box
__Drawing a histogram
__Drawing a pie chart
__Drawing a Stem and Leaf Picture
__Drawing a scatter plot
[Key Points Organized into 6 Keywords]
[Key functions summarized in a table]
[Confirmation question]
Chapter 05 Data Processing
: Extract, sort, or restructure data to make data analysis easier.
05-1 dplyr package
Installing and loading the __dplyr package
__Extracting and Sorting Data
__Add data and remove duplicate data
__Summary data and extract samples
__Pipe operator: %〉%
[Key points summarized in two keywords]
[Key functions summarized in a table]
[Confirmation question]
05-2 Data Processing
__Extract the required data
__Sorting data
__Summarize data
__Combine data
[Key points summarized in four keywords]
[Key functions summarized in a table]
[Confirmation question]
05-3 Transforming Data Structures
__Converting wide-shaped data to long-shaped data: melt( ) function
__Converting long data to wide data: cast( ) function
[Learn more] Summarizing data with the cast( ) function
[Key points summarized in two keywords]
[Key functions summarized in a table]
[Confirmation question]
05-4 Data Cleaning
__Check missing values
__Exclude missing values
__Check the number of missing values
__Remove missing values
__Improve missing values
__Check for outliers
__Handling outliers
[Key points summarized in three keywords]
[Key functions summarized in a table]
[Confirmation question]
Chapter 06 Data Visualization: The ggplot2 Package
: Let's draw a graph using the ggplot2 package, the flower of data visualization.
06-1 Drawing a graph
__Creating the basic graph frame: ggplot( ) function
__Drawing a Scatterplot: geom_point( ) function
Drawing a line graph: geom_line( ) function
__Drawing a bar graph: geom_bar( ) function
__Drawing a Box Plot: geom_boxplot( ) Function
__Drawing a histogram: geom_histogram( ) function
[Learn more 1] Breaking lines of code connected by operators
[Learn more 2] Adding a graph to a graph
[Key points summarized in three keywords]
[Key functions summarized in a table]
[Confirmation question]
06-2 Adding Objects to the Graph
__Drawing diagonal lines: geom_abline( ) function
__Drawing Parallel Lines: geom_hline( ) Function
__Drawing a vertical line: geom_vline( ) function
__Enter a label: geom_text( ) function
__Inserting shapes and arrows: annotate( ) function
[Learn more 1] Adding titles to graphs and axes and applying design themes
[Learn More 2] Finding the Intercept and Slope: Regression Analysis
[Key points summarized in three keywords]
[Key functions summarized in a table]
[Confirmation question]
06-3 Map Visualization: The ggmap Package
__Get a Google Maps API key
Using Google Maps with the __ggmap package
[Key points summarized in three keywords]
[Key functions summarized in a table]
[Confirmation question]
Chapter 07 Developing Skills through Projects
: Based on what we learned above, let's analyze public data ourselves.
07-1 Comparing the distribution of domestic recreational forests by region
__Data Collection: Download National Recreation Forest Standard Data
__Data Processing: Preprocessing with Excel
__Data Analysis: Frequency Analysis and Visualization
[Key points summarized in the analysis phase]
[Key functions summarized in a table]
[Confirmation question]
07-2 Check the trend of overseas arrivals
__Data Collection: Downloading Entry Statistics Data
__Data Processing (1): Preprocessing with Excel
__Data Processing (2): Restructuring Data
__Data Analysis: Visualization
[Key points summarized in the analysis phase]
[Key functions summarized in a table]
[Confirmation question]
07-3 Check the locations of COVID-19 screening clinics on the map.
__Data Collection: Download COVID-19 Screening Clinic Location Information
__Data Processing: Extracting the Required Data
__Data Analysis (1): Frequency Analysis
Data Analysis (2): Map Visualization
[Key points summarized in the analysis phase]
[Key functions summarized in a table]
[Confirmation question]
07-4 Comparing differences in fine dust concentrations by region in Seoul
__Data Collection: Download Seoul's Daily Fine Dust Data
__Data Processing (1): Preprocessing with Excel
__Data Processing (2): Extracting the Required Data
__Data Analysis (1): Exploring and Visualizing Data
__Data Analysis (2): Hypothesis Testing
[Learn More] Testing Mean Differences Between Three or More Groups: Analysis of Variance
[Key points summarized in the analysis phase]
[Key functions summarized in a table]
[Confirmation question]
Chapter 08 Sharing Data Analysis Reports
: Learn how to effectively share your data analysis results.
08-1 Sharing Data Analysis Results with RPubs
Creating an __R Markdown Document
__R Markdown document preview
__Change the save format of the R Markdown document
__Deploy to RPubs
[Learn more] R Markdown syntax
[Key points summarized in four keywords]
[Confirmation question]
08-2 Creating Interactive Web Apps with Shiny
__Create Shiny File
__A look at the SHINee app structure
__Distributing the SHINee app
__input control widget
[Key points summarized in four keywords]
[Key functions summarized in a table]
[Confirmation question]
Appendix A: Introduction to Data Analysis Tools
Answer and explanation
Search
: Introduce the R language and learn why it is used in data analysis.
01-1 Big Data and the R Language
__The era of big data
Introducing the __R language
Pros and Cons of __R
[Key points summarized in three keywords]
[Confirmation question]
01-2 Development Environment Installation
Download the __R installation file
Installing __R
Running __R
__Download the R Studio installation file
Installing __R Studio
[Learn more] R Studio Cloud
[Key points summarized in four keywords]
[Confirmation question]
01-3 R Studio Interface and Environment Settings
__R Studio interface
__Settings
__Setting up the required working environment
__Create and save a script
__Run the code
[Learn more] Using Help
[Key Points Summarized in 5 Keywords]
[Confirmation question]
Chapter 02: Laying the Groundwork for Data Analysis
: Learn about the data analysis process and what data is.
02-1 Data Analysis Process
Step 1: Designing the Data Analysis
Step 2: Prepare the data
Step 3: Processing the Data
Step 4: Analyzing the Data
Step 5: Draw conclusions
[Key Points Summarized in 5 Keywords]
[Confirmation question]
02-2 Appearance of data
__Relationships between data structures and data types
__vector
__Categorical data
__Matrix and Array
__Lists and Data Frames
[Key Points Organized into 6 Keywords]
[Confirmation question]
Chapter 03 Learning R Programming
: Learn the basic syntax of R programming.
03-1 Variables and Functions
__Create a variable
__Calling a function
__Using built-in functions
__Creating a custom function
Why use the __return( ) function?
[Key Points Summarized in 5 Keywords]
[Confirmation question]
Package 03-2
Installing the __package
__Check installed packages
__Loading the package
__Delete package
__Using the main package
[Learn more] Find the package you need
[Key points summarized in four keywords]
[Key functions summarized in a table]
[Confirmation question]
03-3 Conditional statements and loops
__operator
__if-else conditional statement
__loop
[Learn More] Troubleshooting R Code Errors
[Key Points Organized into 6 Keywords]
[Key functions summarized in a table]
[Confirmation question]
Chapter 04 Handling Data
: Learn how to collect, observe, and explore data to understand its characteristics.
04-1 Collecting Data
__Enter data directly
__Import external data: TXT file
__Import external data: CSV files
__Import external data: Excel file
__Import external data: XML, JSON files
[Key points summarized in four keywords]
[Key functions summarized in a table]
[Confirmation question]
04-2 Observing Data
__Check all data
__Check the data summary
__Check descriptive statistics
__Analyzing data frequency
[Key Points Organized into 6 Keywords]
[Key functions summarized in a table]
[Confirmation question]
04-3 Exploring Data
__Drawing a bar graph
__Drawing a box
__Drawing a histogram
__Drawing a pie chart
__Drawing a Stem and Leaf Picture
__Drawing a scatter plot
[Key Points Organized into 6 Keywords]
[Key functions summarized in a table]
[Confirmation question]
Chapter 05 Data Processing
: Extract, sort, or restructure data to make data analysis easier.
05-1 dplyr package
Installing and loading the __dplyr package
__Extracting and Sorting Data
__Add data and remove duplicate data
__Summary data and extract samples
__Pipe operator: %〉%
[Key points summarized in two keywords]
[Key functions summarized in a table]
[Confirmation question]
05-2 Data Processing
__Extract the required data
__Sorting data
__Summarize data
__Combine data
[Key points summarized in four keywords]
[Key functions summarized in a table]
[Confirmation question]
05-3 Transforming Data Structures
__Converting wide-shaped data to long-shaped data: melt( ) function
__Converting long data to wide data: cast( ) function
[Learn more] Summarizing data with the cast( ) function
[Key points summarized in two keywords]
[Key functions summarized in a table]
[Confirmation question]
05-4 Data Cleaning
__Check missing values
__Exclude missing values
__Check the number of missing values
__Remove missing values
__Improve missing values
__Check for outliers
__Handling outliers
[Key points summarized in three keywords]
[Key functions summarized in a table]
[Confirmation question]
Chapter 06 Data Visualization: The ggplot2 Package
: Let's draw a graph using the ggplot2 package, the flower of data visualization.
06-1 Drawing a graph
__Creating the basic graph frame: ggplot( ) function
__Drawing a Scatterplot: geom_point( ) function
Drawing a line graph: geom_line( ) function
__Drawing a bar graph: geom_bar( ) function
__Drawing a Box Plot: geom_boxplot( ) Function
__Drawing a histogram: geom_histogram( ) function
[Learn more 1] Breaking lines of code connected by operators
[Learn more 2] Adding a graph to a graph
[Key points summarized in three keywords]
[Key functions summarized in a table]
[Confirmation question]
06-2 Adding Objects to the Graph
__Drawing diagonal lines: geom_abline( ) function
__Drawing Parallel Lines: geom_hline( ) Function
__Drawing a vertical line: geom_vline( ) function
__Enter a label: geom_text( ) function
__Inserting shapes and arrows: annotate( ) function
[Learn more 1] Adding titles to graphs and axes and applying design themes
[Learn More 2] Finding the Intercept and Slope: Regression Analysis
[Key points summarized in three keywords]
[Key functions summarized in a table]
[Confirmation question]
06-3 Map Visualization: The ggmap Package
__Get a Google Maps API key
Using Google Maps with the __ggmap package
[Key points summarized in three keywords]
[Key functions summarized in a table]
[Confirmation question]
Chapter 07 Developing Skills through Projects
: Based on what we learned above, let's analyze public data ourselves.
07-1 Comparing the distribution of domestic recreational forests by region
__Data Collection: Download National Recreation Forest Standard Data
__Data Processing: Preprocessing with Excel
__Data Analysis: Frequency Analysis and Visualization
[Key points summarized in the analysis phase]
[Key functions summarized in a table]
[Confirmation question]
07-2 Check the trend of overseas arrivals
__Data Collection: Downloading Entry Statistics Data
__Data Processing (1): Preprocessing with Excel
__Data Processing (2): Restructuring Data
__Data Analysis: Visualization
[Key points summarized in the analysis phase]
[Key functions summarized in a table]
[Confirmation question]
07-3 Check the locations of COVID-19 screening clinics on the map.
__Data Collection: Download COVID-19 Screening Clinic Location Information
__Data Processing: Extracting the Required Data
__Data Analysis (1): Frequency Analysis
Data Analysis (2): Map Visualization
[Key points summarized in the analysis phase]
[Key functions summarized in a table]
[Confirmation question]
07-4 Comparing differences in fine dust concentrations by region in Seoul
__Data Collection: Download Seoul's Daily Fine Dust Data
__Data Processing (1): Preprocessing with Excel
__Data Processing (2): Extracting the Required Data
__Data Analysis (1): Exploring and Visualizing Data
__Data Analysis (2): Hypothesis Testing
[Learn More] Testing Mean Differences Between Three or More Groups: Analysis of Variance
[Key points summarized in the analysis phase]
[Key functions summarized in a table]
[Confirmation question]
Chapter 08 Sharing Data Analysis Reports
: Learn how to effectively share your data analysis results.
08-1 Sharing Data Analysis Results with RPubs
Creating an __R Markdown Document
__R Markdown document preview
__Change the save format of the R Markdown document
__Deploy to RPubs
[Learn more] R Markdown syntax
[Key points summarized in four keywords]
[Confirmation question]
08-2 Creating Interactive Web Apps with Shiny
__Create Shiny File
__A look at the SHINee app structure
__Distributing the SHINee app
__input control widget
[Key points summarized in four keywords]
[Key functions summarized in a table]
[Confirmation question]
Appendix A: Introduction to Data Analysis Tools
Answer and explanation
Search
Detailed image
.jpg)
Publisher's Review
Who is this book for?
- Beginner learning both programming and statistics
- Non-majors who want to start data analysis using the R language
- A statistics major who took R language classes in college but still has regrets
-Workers who lack the time and resources to learn data analysis through academies or lectures.
-Anyone interested in data analysis
Book Features
First, a solid learning design that systematically repeats the "7-step structure tailored for beginners"!
This book is structured so that the core contents of R data analysis can be naturally memorized through repeated learning in seven steps.
In each section, we warm up with the representative concepts of each section's topic through [Key Keywords] and [Before You Begin], then go through the core theories and practices of data analysis in earnest, and at the end, we review them all at once with [Key Points] and [Confirmation Questions].
If you follow the curriculum that allows you to study on your own, even beginners in R data analysis who are new to programming and statistics will be able to finish the book without difficulty!
Second, learn core grammar through 193 hands-on "hand-coding" exercises, and develop your data analysis skills through four projects!
It contains 193 carefully selected practical examples that allow you to read and understand the core grammar and theory with ease, and learn the R coding sense through hands-on experience.
By following the repetitive learning and practice that beginners need most, you can make the code in the book into 'your own code.'
Finally, by analyzing public data using the R language, you can personally learn the entire data analysis process, from data collection to analysis results.
Third, video lectures and learning sites to empower "honkong" (studying together).
http://hongong.hanbit.co.kr
For beginners who still find it difficult to learn from books alone, we also provide videos of lectures directly from the author.
We also provide a learning site so that you can ask questions at any time while learning.
The author personally answers each question and also shares the latest technologies and information related to the R language.
In addition, we operate a self-study group for those who want to study alone but lack confidence in doing so, and we provide maximum support so that readers can complete the course without giving up.
Fourth, we provide a glossary of essential terms for studying alone, so you can read them anytime, anywhere.
We provide a [Terminology Note] that organizes only the key concepts and terms that you must remember.
Through beta readers, we have confirmed that the reason beginners find programming difficult is because of unfamiliar terminology.
However, it is not difficult, but rather confusing due to unfamiliarity, so whenever you have trouble remembering a term or concept, feel free to open your glossary.
Another fun part of the process is completing your own glossary by adding new terms in addition to the ones provided.
·This book is like an 'alphabet of data analysis' that is easy to follow and helps you approach data analysis.
- Beta leader Kwak Kyung-tae
·If you don't know where to ask questions about data analysis and are at a loss as to where to start, this book will be a great guide.
- Beta leader Park Jo-eun
·When you read this book, you will experience the entire process of data analysis.
- Beta leader Son Ji-min
· We provide helpful explanations on how to resolve errors that may occur during practice, so you can focus solely on learning.
- Beta leader Yang Min-hyeok
·You can learn by reading the explanations and coding right away, and you can confirm the concepts with the conclusion at the end of each section.
- Beta leader Lee Dong-hee
·Detailed explanations of development environment settings, terminology, and code are provided to avoid frustration for beginners before they even begin.
- Beta leader Im Hyeok
- Beginner learning both programming and statistics
- Non-majors who want to start data analysis using the R language
- A statistics major who took R language classes in college but still has regrets
-Workers who lack the time and resources to learn data analysis through academies or lectures.
-Anyone interested in data analysis
Book Features
First, a solid learning design that systematically repeats the "7-step structure tailored for beginners"!
This book is structured so that the core contents of R data analysis can be naturally memorized through repeated learning in seven steps.
In each section, we warm up with the representative concepts of each section's topic through [Key Keywords] and [Before You Begin], then go through the core theories and practices of data analysis in earnest, and at the end, we review them all at once with [Key Points] and [Confirmation Questions].
If you follow the curriculum that allows you to study on your own, even beginners in R data analysis who are new to programming and statistics will be able to finish the book without difficulty!
Second, learn core grammar through 193 hands-on "hand-coding" exercises, and develop your data analysis skills through four projects!
It contains 193 carefully selected practical examples that allow you to read and understand the core grammar and theory with ease, and learn the R coding sense through hands-on experience.
By following the repetitive learning and practice that beginners need most, you can make the code in the book into 'your own code.'
Finally, by analyzing public data using the R language, you can personally learn the entire data analysis process, from data collection to analysis results.
Third, video lectures and learning sites to empower "honkong" (studying together).
http://hongong.hanbit.co.kr
For beginners who still find it difficult to learn from books alone, we also provide videos of lectures directly from the author.
We also provide a learning site so that you can ask questions at any time while learning.
The author personally answers each question and also shares the latest technologies and information related to the R language.
In addition, we operate a self-study group for those who want to study alone but lack confidence in doing so, and we provide maximum support so that readers can complete the course without giving up.
Fourth, we provide a glossary of essential terms for studying alone, so you can read them anytime, anywhere.
We provide a [Terminology Note] that organizes only the key concepts and terms that you must remember.
Through beta readers, we have confirmed that the reason beginners find programming difficult is because of unfamiliar terminology.
However, it is not difficult, but rather confusing due to unfamiliarity, so whenever you have trouble remembering a term or concept, feel free to open your glossary.
Another fun part of the process is completing your own glossary by adding new terms in addition to the ones provided.
·This book is like an 'alphabet of data analysis' that is easy to follow and helps you approach data analysis.
- Beta leader Kwak Kyung-tae
·If you don't know where to ask questions about data analysis and are at a loss as to where to start, this book will be a great guide.
- Beta leader Park Jo-eun
·When you read this book, you will experience the entire process of data analysis.
- Beta leader Son Ji-min
· We provide helpful explanations on how to resolve errors that may occur during practice, so you can focus solely on learning.
- Beta leader Yang Min-hyeok
·You can learn by reading the explanations and coding right away, and you can confirm the concepts with the conclusion at the end of each section.
- Beta leader Lee Dong-hee
·Detailed explanations of development environment settings, terminology, and code are provided to avoid frustration for beginners before they even begin.
- Beta leader Im Hyeok
GOODS SPECIFICS
- Date of issue: January 17, 2022
- Page count, weight, size: 444 pages | 954g | 188*257*20mm
- ISBN13: 9791162245019
- ISBN10: 1162245018
You may also like
카테고리
korean


korean

![GQ KOREA Mark (Monthly): December [2025]](http://librairie.coreenne.fr/cdn/shop/files/8ef265dbbfbf186523ed75ba7319009d.jpg?v=1765340328&width=3840)


