

Math is difficult, but I want to know probability and statistics.
 |
Description
Book Introduction
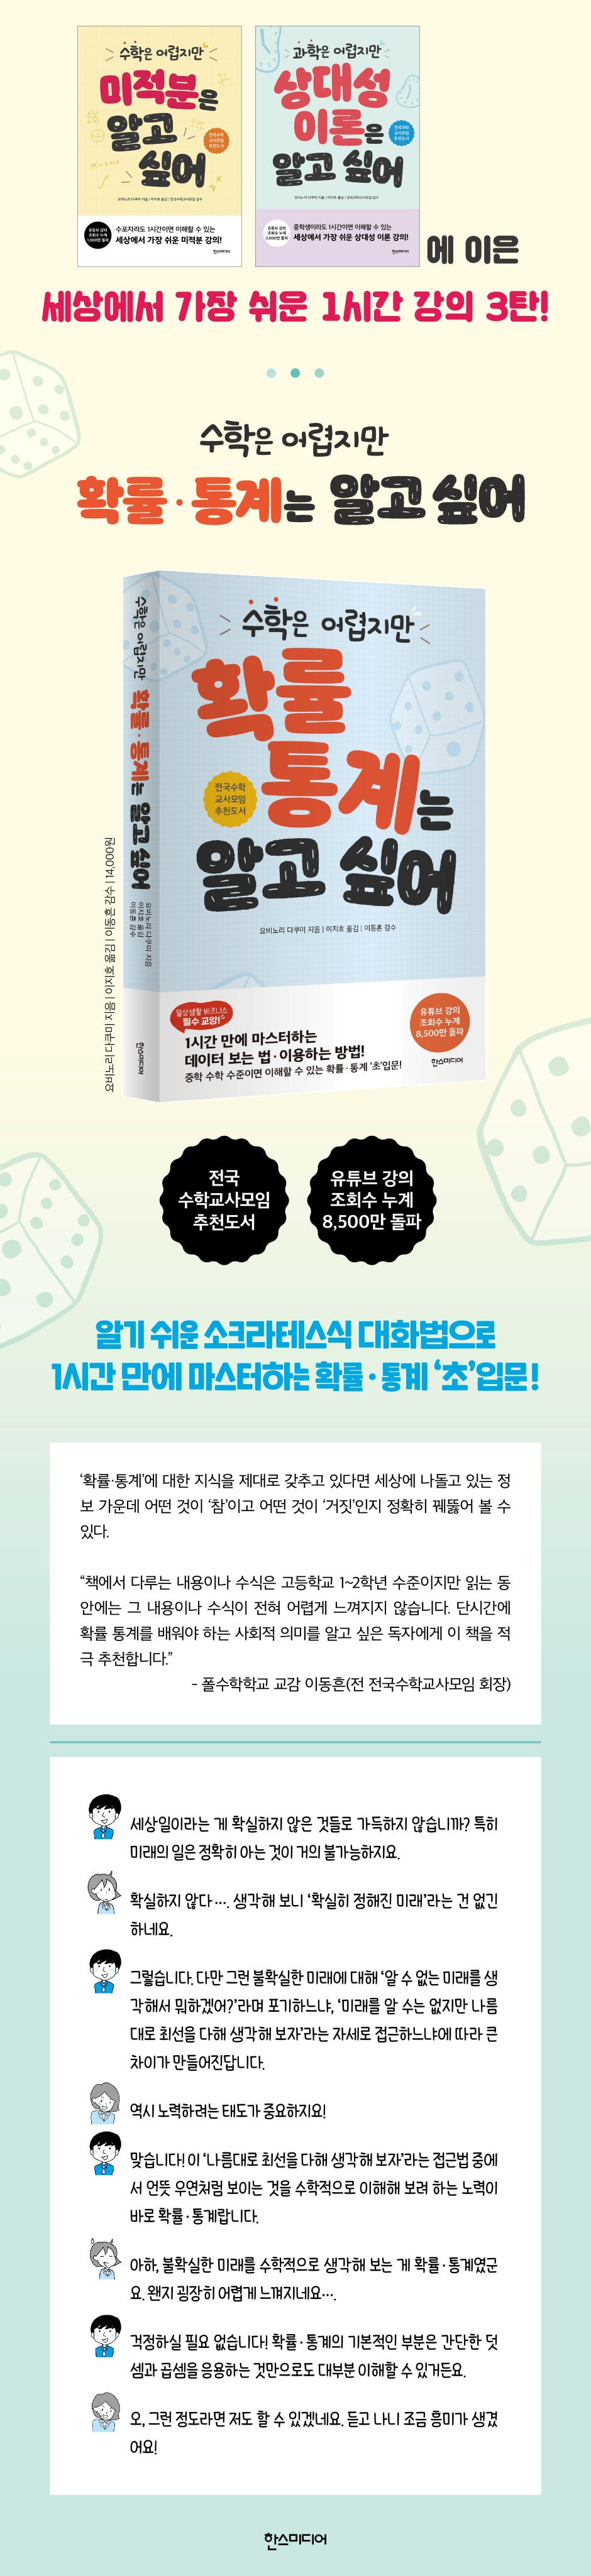
Master it in just one hour in an easy-to-understand conversational format.
How to view and use probability and statistical data!
"Math is difficult, but I want to know probability and statistics" is a book written by Takumi Yobinori, a popular Japanese education YouTuber, in which the basic principles of how to view and utilize probability and statistics data are explained in an easy-to-understand manner at a middle school level, so that anyone can understand them in just one hour.
'Probability and Statistics' is a familiar topic that can be immediately applied to daily life and business, compared to 'Calculus' or 'Theory of Relativity', which the author covered in his previous books.
Although it is knowledge that is very helpful in real life, the reality is that people are afraid of it and avoid it, thinking, "It will be difficult to understand without specialized knowledge," or "The complicated calculations will give me a headache."
To address these concerns, the author, like his previous work, has completed a one-hour lecture in a conversational format, using familiar examples that anyone can experience, aimed at people who are not confident in mathematics, so that they can clearly understand the essence of 'probability and statistics' with just simple additions and multiplications.
After reading this book, you will experience the miracle of opening your eyes to mathematical thinking, thinking, "I've never taken a 'probability and statistics' class like this before!"
- You can preview some of the book's contents.
Preview
index
Reviewer's note
preface
HOME ROOM 1 Probability and statistics are essential subjects for business people!
HOME ROOM 2 Studying probability and statistics can help you make good decisions.
HOME ROOM 3 Studying probability and statistics can help you see through the world's lies.
Using HOME ROOM 4 statistics greatly increases your 'persuasiveness'!
HOME ROOM 5 Studying statistics will help you master how to use data!
Chapter 1 What is probability?
LESSON 1 Probability refers to the degree to which an event is likely to occur.
LESSON 2 Let's calculate the probability!
LESSON 3: The point of probability is 'is it equally possible' or 'is it not?'
LESSON 4 What if something is 'not equally possible'?
LESSON 5: Which is more advantageous: drawing lots first or drawing them later?
LESSON 6 Why do the odds become 'the same' when 'drawing lots in order'?
LESSON 7: How to Calculate the Number of Cases in a 'Select and List Problem'
LESSON 8 Calculating 'nPr' is no longer scary!
LESSON 9 Let's quickly calculate 'transposition' using factorial!
LESSON 10: How to Calculate Combinatorial Problems
LESSON 11: How to Use Combinatorial Problems
Chapter 2 What are Statistics?
LESSON 1: Learn 'Statistics' and become stronger in business!
LESSON 2 What is the 'typical value', a basic concept in statistics?
LESSON 3: The First Step to Representative Values? The 'Average'
LESSON 4: Is the median more helpful than the average score?
LESSON 5: The Most Frequently Occurring 'Mode'
LESSON 6: The way you view data changes depending on the 'representative value'!
LESSON 7: Examining the "Jaggedness of Data" with "Standard Deviation"
LESSON 8 What is 'deviation value'?
LESSON 9 What is 'correlation'?
LESSON 10 Be careful when using 'correlation'!
LESSON 11 What are the pitfalls of 'correlation'?
LESSON 12: How to Spot False Correlations
LESSON 13 Don't be fooled by 'lies using correlation'!
LESSON 14 Can we see through the true nature of 'God's miracles' using probability and statistics?
Detailed image
Into the book
Especially in today's information-saturated age, there is also an abundance of information with low credibility.
If you study probability and statistics properly, you will be able to make decisions with a slightly higher probability of success, quickly detect useful information, and acquire the knowledge to become a businessperson.
--- p.32 「Home Room 5.
"If you study statistics, you can master 'how to utilize data!'"
In this case, A draws his lot first before B draws his lot.
Since the situation changes depending on the result, we need to calculate the pattern from the moment A first draws the lottery.
First, consider the five patterns in which A draws lots.
Then, in each case, we have to consider the case where B draws the remaining lots.
--- p.60 「Chapter 1.
Lesson 5.
"Which is more advantageous, drawing the 'lottery' first or drawing it later?"
If you just look at the text, it might seem difficult.
Here, 'P' is a symbol representing 'Permutation', and the small letters n and r on the left and right are letters indicating how many to choose from.
For example, in the previous example, we chose three out of four people and lined them up, right? If we use this symbol to represent the result, it becomes 4P3 = 4 × 3 × 2 = 24.
--- p.79 「Chapter 1.
Lesson 8.
In this way, you won't be afraid of calculating 'nPr'!」
Statistics deals with vast amounts of data.
For example, YouTube has a variety of data, such as the number of viewers, age, and viewing time, but it would be impossible to quickly understand what the numbers mean just by looking at them.
Just thinking about it gives me goosebumps.
But wouldn't it be convenient if we could express that characteristic as a single number? That number is called a "representative value."
--- p.112 「Chapter 2.
Lesson 2.
From "What is the 'representative value', the basics of statistics?"
Depending on how unevenly the data is distributed, the ability to effectively represent the data's characteristics using the mean, median, or mode greatly differs.
For example, if you look at a job information site, there may be a section called "average annual salary" for a company, but you should keep in mind that this may not match the amount you can actually earn.
This is because it is possible that only some people have exceptionally high salaries.
--- p.129~130 「Chapter 2.
Lesson 6.
From "The perspective on data changes depending on the 'representative value'!"
Although the saying that 'drinking beer makes you gain weight' seems to be empirically correct, the actual calories in beer itself are not high.
Some say that the cause is the snacks eaten while drinking beer.
Because there may be multiple common factors between two events, we cannot assert causality based on a single correlation alone.
--- p.178~179 「Chapter 2.
Lesson 13.
Don't be fooled by 'lies using correlation'!
Lesson 13.
Don't be fooled by 'lies using correlation'!
Publisher's Review
Probability and statistics help you make accurate judgments at the moment of decision-making.
With the development of IT technology, a flood of information has emerged, making it difficult to distinguish between the wheat and chaff in the information you want.
In times like these, we tend to rely on our own experiences and senses to make decisions.
However, decisions made solely based on feelings often lead to poor results because they are not sufficiently verified.
'Probability and statistics' can help you make choices that allow you to make accurate judgments at these decision-making moments.
This is because 'probability and statistics' is a discipline that tries to mathematically understand uncertainty to the best of its ability.
In this book, the author provides an easy-to-understand explanation of the basic principles of probability and statistics, using specific examples to help you make the best decisions possible about your future work or business.
In particular, it helps with understanding of terms related to probability and statistics by using materials and cases commonly encountered in daily life as examples, and attempts to convert meanings into numerical symbols, and visually expresses concepts through pictures and graphs so that anyone can easily understand them.
Studying statistics will greatly increase your 'persuasive power'!
Numbers based on statistics have a strong persuasive power.
Florence Nightingale, known as the Angel in White, made a significant contribution to improving unsanitary conditions while working in hospitals where soldiers injured on the battlefield were admitted.
At the time, no one listened to Nightingale because she was a nurse and a woman with little say. However, Nightingale was able to gain support by analyzing a large amount of data and presenting statistical data showing that 'most of the causes of death among soldiers were due to unsanitary conditions in hospitals.'
This case demonstrates how powerful and persuasive the "power of numbers" based on statistics can be.
'Probability and Statistics' is an essential subject for businessmen preparing for the future!
It is true that using statistical data to persuade others can make it easier to persuade them.
But there is also a scary aspect to this: the data can be manipulated to one's advantage, making even completely unreliable information seem plausible.
In other words, statistics have a double-edged sword: they can be helpful to people or used for fraud, depending on how they are used.
Therefore, the more information you use using statistical data, the more you need your own value judgment criteria to correctly determine what the actual truth is.
Especially in today's information-rich era, the need to properly study probability and statistics is growing, as the likelihood of making wrong decisions due to incorrect statistical information increases.
In a world overflowing with data, only those who can analyze it with their own unique perspective and discover meaningful value will be able to dominate the future.
In this book, the author seeks to impart the power of reasoning that helps us easily understand probability and statistics as an alternative to overcoming the harmful effects of information polarization caused by the gap between data acceptance and interpretation levels.
He says that the reason we need to study 'probability and statistics' is to quickly gain the power to find the information necessary to make rational decisions in a world overflowing with data, and he sincerely hopes that even one more person will open their eyes to 'mathematical thinking'.
GOODS SPECIFICS
- Date of issue: August 17, 2021
- Page count, weight, size: 188 pages | 258g | 128*188*13mm
- ISBN13: 9791160077179
- ISBN10: 1160077177
You may also like
카테고리
korean


korean

![GQ KOREA Mark (Monthly): December [2025]](http://librairie.coreenne.fr/cdn/shop/files/8ef265dbbfbf186523ed75ba7319009d.jpg?v=1765340328&width=3840)


